Journal of Peking University (Health Sciences) ›› 2025, Vol. 57 ›› Issue (3): 537-544. doi: 10.19723/j.issn.1671-167X.2025.03.018

Previous Articles     Next Articles

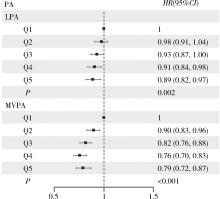
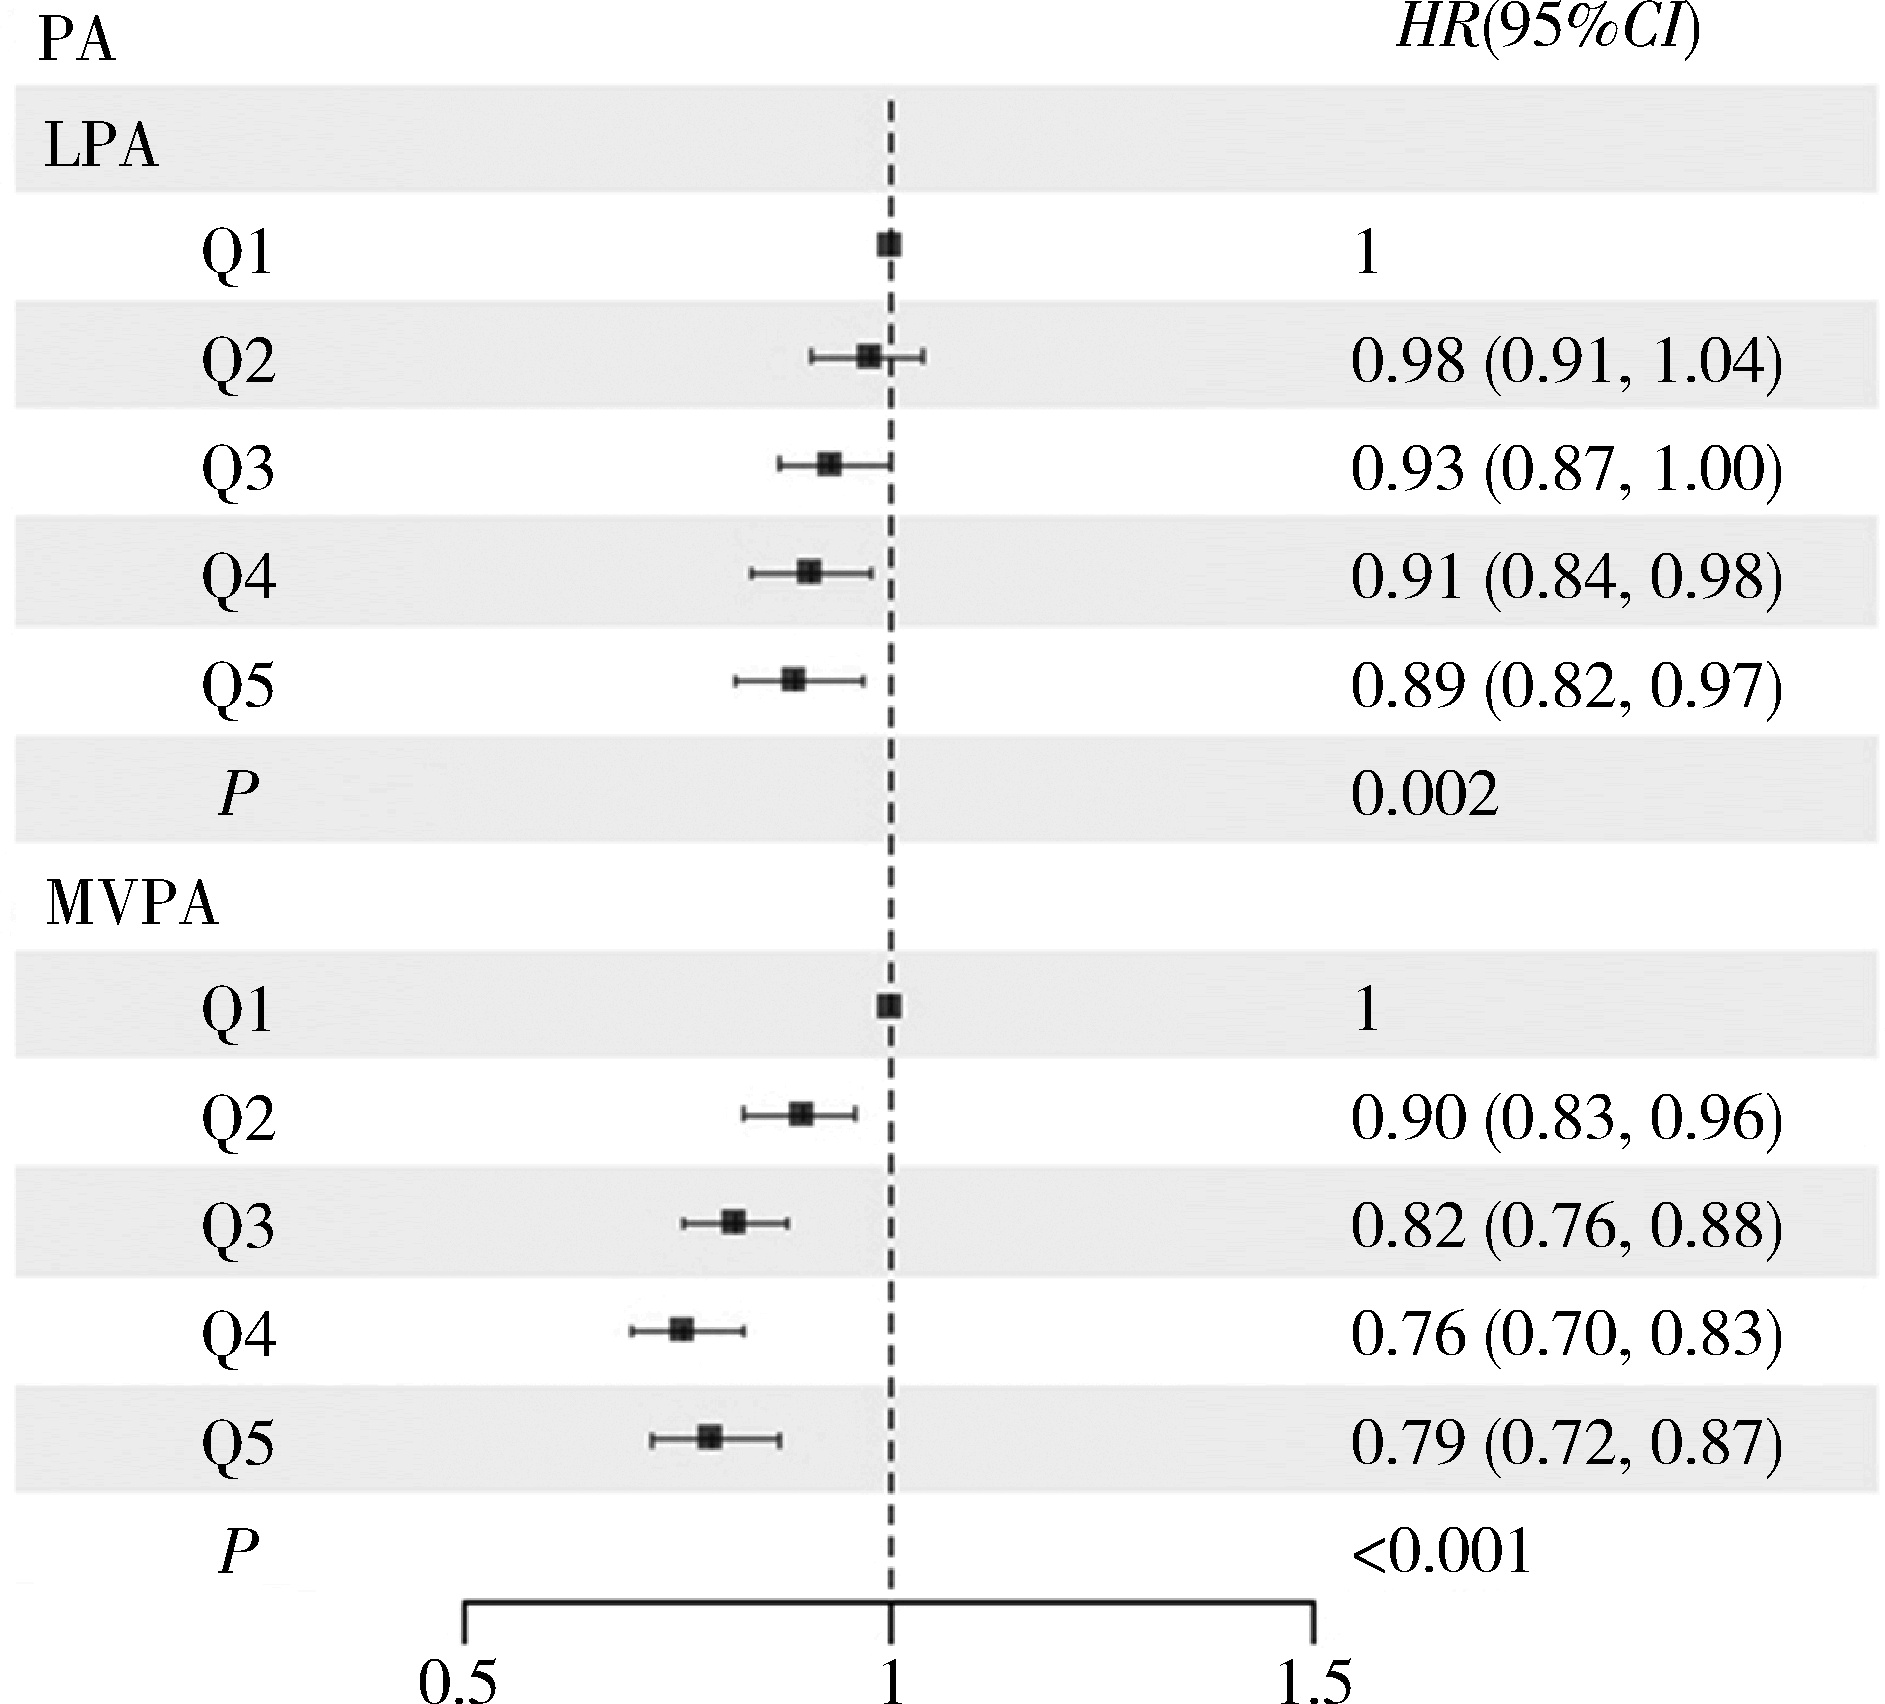
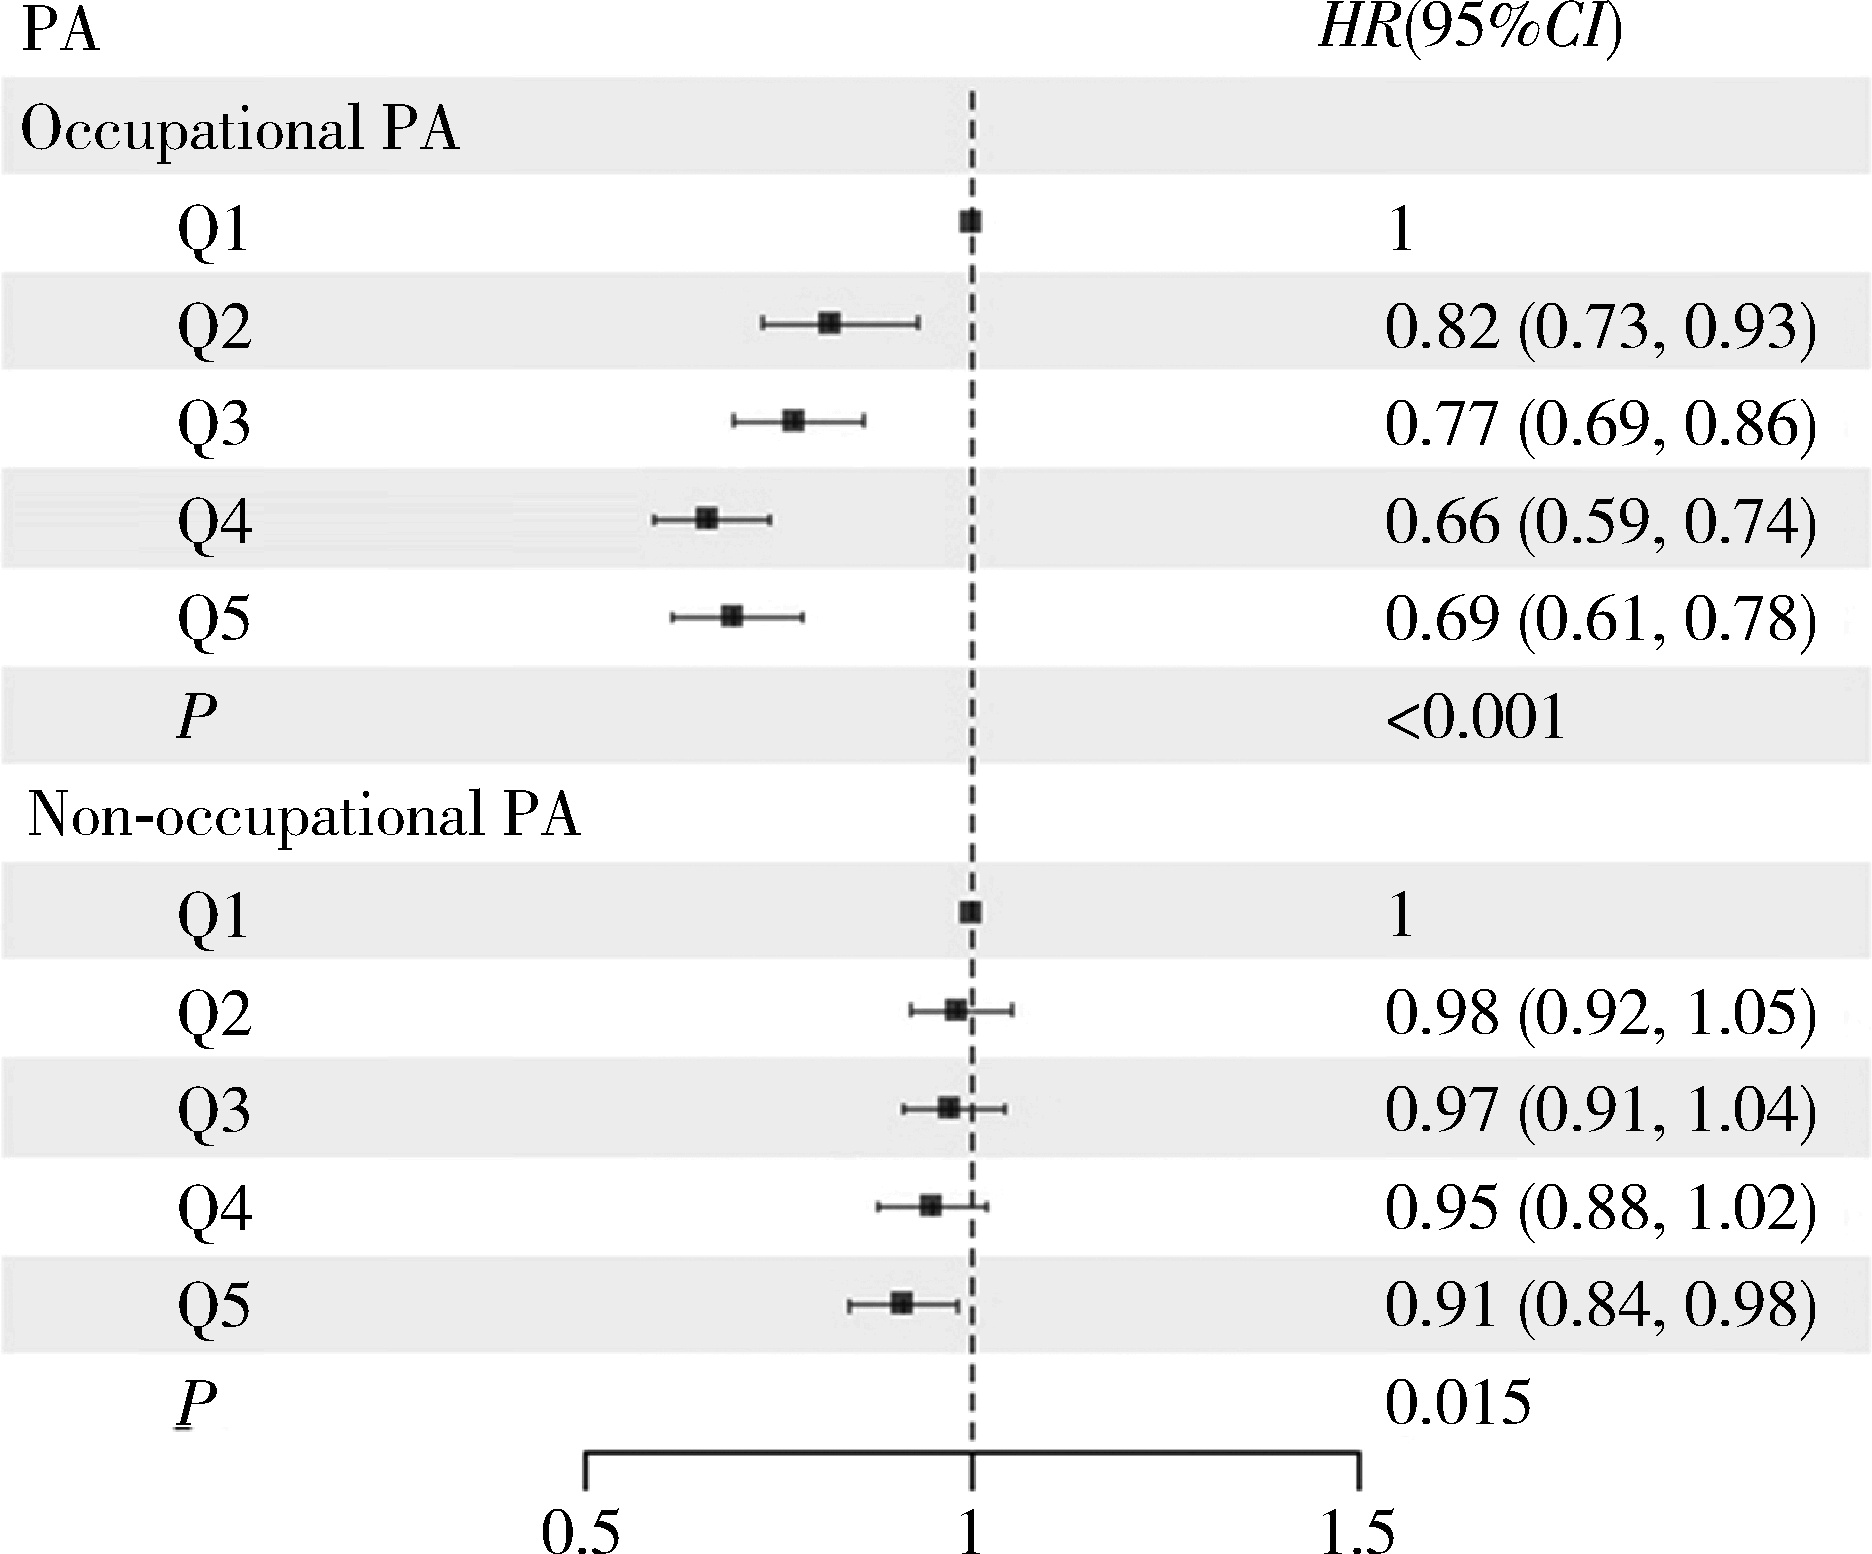
Prospective association between physical activity and mortality in patients with chronic obstructive pulmonary disease

Shuo ZHANG1, Yongbing LAN1, Dianjianyi SUN1,2,3, Pei PEI2, Huaidong DU4, Junshi CHEN5, Zhengming CHEN4, Jun LV1,2,3,6, Liming LI1,2,3, Canqing YU1,2,3,*(), (for the China Kadoorie Biobank Collaborative Group)   

  1. 1. Department of Epidemiology & Biostatistics, Peking University School of Public Health, Beijing 100191, China
    2. Peking University Center for Public Health and Epidemic Preparedness & Response, Beijing 100191, China
    3. Key Laboratory of Epidemiology of Major Diseases (Peking University), Ministry of Education, Beijing 100191, China
    4. Clinical Trial Service Unit and Epidemiological Studies Unit, Nuffield Department of Population Health, University of Oxford, Oxford OX3 7LF, UK
    5. China National Center for Food Safety Risk Assessment, Beijing 100022, China
    6. State Key Laboratory of Vascular Homeostasis and Remodeling, Peking University, Beijing 100191, China
  • Received:2025-02-04 Online:2025-06-18 Published:2025-06-13
  • Contact: Canqing YU
  • Supported by:
    the Noncommunicable Chronic Diseases-National Science and Technology Major Project(2023ZD0510100); National Natural Science Foundation of China(82192901); National Natural Science Foundation of China(82192904); National Natural Science Foundation of China(82192900); National Natural Science Foundation of China(82388102); Wellcome grants to Oxford University(212946/Z/18/Z); Wellcome grants to Oxford University(202922/Z/16/Z); Wellcome grants to Oxford University(104085/Z/14/Z); Wellcome grants to Oxford University(088158/Z/09/Z); Kadoorie Charitable Foundation in Hong Kong

RICH HTML


Abstract:

Objective: To explore the prospective association between physical activity level and mortality risk in Chinese adults with chronic obstructive pulmonary disease (COPD). Methods: Based on the China Kadoorie Biobank (CKB) who had COPD at the baseline survey, this study employed the Cox proportional hazards regression model to estimate the prospective associations between the overall physical activity, different intensities (low-level, moderate-to-vigorous-level), and types (occupational, non-occupational) of physical activity level and the risks of all-cause and cause-specific mortality, such as vascular diseases, cancer, and respiratory diseases. Based on the quintiles of physical activity level, participants were divided into five groups (Q1-Q5), with the lowest quintile group (Q1) as the reference group. Hazard ratio (HR) and 95% confidence interval (95%CI) were calculated for the remaining. In our study, we also performed sensitivity and subgroup analyses, including age, gender, self-rated health status, severity of COPD, etc. Results: Among 33 588 COPD patients at the baseline survey, 8 314 (22.2%) deaths were documented during an average follow-up of (11.1±3.1) years. Negative linear associations between the overall physical activity level and mortality risk from all-cause, vascular, and respiratory diseases were observed (P trend for linear correlation being < 0.001, 0.002, < 0.001). Compared with the lowest quintile group of total physical activity (Q1), the hazard ratios (HR) and 95% confidence intervals (CI) for all-cause mortality, vascular disease mortality, and respiratory disease mortality in the highest quintile group (Q5) were 0.77 (0.70, 0.85), 0.77 (0.65, 0.91), and 0.58 (0.48, 0.71), respectively. The low-level and moderate-to-vigorous-level physical activity were negatively associated with all-cause mortality in the COPD patients (P trend for linear correlation: 0.002, < 0.001, respectively). Compared with the lowest quintile group of low-intensity and moderate-to-vigorous intensity physical activity (Q1), the HRs (95%CI) for all-cause mortality in the highest quintile group (Q5) were 0.89 (0.82, 0.97) and 0.79 (0.72, 0.87), respectively. The occupational and non-occupational physical activity were also found to have a linear inverse association with all-cause mortality risk among the COPD patients (P trend < 0.001 and 0.015, respectively). Compared with the lowest quintile group of occupational and non-occupational physical activity (Q1), the HR (95%CI) for all-cause mortality in the highest quintile group (Q5) were 0.69 (0.61, 0.78) and 0.91 (0.84, 0.98), respectively. The associations between overall physical activity and all-cause mortality risk were stronger for patients aged 60 and above, female, and who reported poor health status (P for interaction: 0.028, 0.012, 0.010). The protective effect of total physical activity was also applicable to the COPD patients of varying severity. Conclusion: Physical activity could reduce the mortality risk in a dose-response relationship among COPD patients, regardless of its intensity and type, especially among individuals aged 60 and above, females, and those with poor self-report health status.

Key words: Chronic obstructive pulmonary disease, Physical activity, Mortality, Prospective association

CLC Number: 

  • R184

Table 1

Baseline characteristics of COPD participants by level of total physical activity"

Characteristic Quintiles of total physical activity F/χ2 P
Q1 (n=6 774) Q2 (n=6 668) Q3 (n=6 731) Q4 (n=6 698) Q5 (n=6 717)
Age/years,${\bar x}$±s 64.4±8.8 61.6±9.7 58.1±10.5 55.0±10.3 52.0±9.5 1 746.7 < 0.001
Gender, n (%) 1 155.9 < 0.001
  Female 2 405 (35.5) 4 174 (62.6) 3 655 (54.3) 3 697 (55.2) 3 009 (44.8)
  Male 4 369 (64.5) 2 494 (37.4) 3 076 (45.7) 3 001 (44.8) 3 708 (55.2)
Area, n (%) 538.2 < 0.001
  Urban 3 069 (45.3) 2 714 (40.7) 2 275 (33.8) 1 842 (27.5) 2 317 (34.5)
  Rural 3 705 (54.7) 3 954 (59.3) 4 456 (66.2) 4 856 (72.5) 4 400 (65.5)
Married, n (%) 19.44 0.001
  Married 5 731 (84.6) 5 661 (84.9) 5 829 (86.6) 5 800 (86.6) 5 803 (86.4)
  Other 1 043 (15.4) 1 007 (15.1) 902 (13.4) 898 (13.4) 914 (13.6)
Education, n (%) 86.72 < 0.001
  Middle school and higher 2 249 (33.2) 2 174 (32.6) 2 214 (32.9) 2 043 (30.5) 1 840 (27.4)
  Primary school and lower 4 525 (66.8) 4 494 (67.4) 4 517 (67.1) 4 655 (69.5) 4 877 (72.6)
Household income, n (%) 55.75 < 0.001
  ≥20 000 yuan/year 2 113 (31.2) 2 274 (34.1) 2 430 (36.1) 2 197 (32.8) 2 230 (33.2)
   < 20 000 yuan/year 4 661 (68.8) 4 394 (65.9) 4 301 (63.9) 4 501 (67.2) 4 487 (66.8)
Occupation, n (%) 3 949.37 < 0.001
  Agriculture and industrial 2 174 (32.1) 2 634 (39.5) 4 146 (61.6) 4 930 (73.6) 5 145 (76.6)
  Other occupation 4 600 (67.9) 4 034 (60.5) 2 585 (38.4) 1 768 (26.4) 1 572 (23.4)
Regular consumption of meat, n (%) 31.86 < 0.001
  ≥4 d/week 2 757 (40.7) 2 674 (40.1) 2 612 (38.8) 2 451 (36.6) 2 646 (39.4)
   < 4 d/week 4 017 (59.3) 3 994 (59.9) 4 119 (61.2) 4 247 (63.4) 4 071 (60.6)
Regular consumption of fresh vegetables, n (%) 12.81 0.012
  ≥4 d/week 6 672 (98.5) 6 588 (98.8) 6 643 (98.7) 6 571 (98.1) 6 616 (98.5)
   < 4 d/week 102 (1.5) 80 (1.2) 88 (1.3) 127 (1.9) 101 (1.5)
Regular consumption of fresh fruit, n (%) 104.56 < 0.001
  ≥4 d/week 1 531 (22.6) 1 607 (24.1) 1 602 (23.8) 1 326 (19.8) 1 209 (18.0)
   < 4 d/week 5 243 (77.4) 5 061 (75.9) 5 129 (76.2) 5 372 (80.2) 5 508 (82.0)
Drinking status, n (%) 52.19 < 0.001
  Current weekly drinker 2 683 (39.6) 2 627 (39.4) 2 706 (40.2) 2 693 (40.2) 2 821 (42.0)
  Non-current weekly drinker 4 091 (60.4) 4 041 (60.6) 4 025 (59.8) 4 005 (59.8) 3 896 (58.0)
Smoking status, n (%) 18.58 0.001
  Current daily smoker 1 009 (14.9) 1 014 (15.2) 1 198 (17.8) 1 192 (17.8) 1 243 (18.5)
  Non-current smoker 5 765 (85.1) 5 654 (84.8) 5 533 (82.2) 5 506 (82.2) 5 474 (81.5)
BMI/(kg/m2),${\bar x}$±s 22.8±3.8 22.8±3.7 22.8±3.5 22.5±3.4 22.5±3.2 10.65 < 0.001
Sedentary/ (h/d),${\bar x}$±s 3.5±2.0 3.5±1.8 3.1±1.6 2.7±1.5 2.5±1.4 390.75 < 0.001
GOLD, n (%) 456.27 < 0.001
  1 1 687 (24.9) 1 840 (27.6) 2 006 (29.8) 1 942 (29.0) 2 042 (30.4)
  2 3 184 (47.0) 3 194 (47.9) 3 150 (46.8) 3 275 (48.9) 3 379 (50.3)
  3 1 429 (21.1) 1 300 (19.5) 1 292 (19.2) 1 233 (18.4) 1 101 (16.4)
  4 474 (7.0) 334 (5.0) 283 (4.2) 248 (3.7) 195 (2.9)
Self-assessed health status, n (%) 362.41 < 0.001
  Excellent 644 (9.5) 785 (11.8) 828 (12.3) 824 (12.3) 804 (11.9)
  Good 1 361 (20.1) 1 426 (21.4) 1 615 (24.0) 1 567 (23.4) 1 798 (26.8)
  Average 2 994 (44.2) 3 065 (45.9) 3 110 (46.2) 3 182 (47.5) 3 054 (45.5)
  Poor 1 775 (26.2) 1 392 (20.9) 1 178 (17.5) 1 125 (16.8) 1 061 (15.8)
Coronary heart disease, n (%) 46.98 < 0.001
  Yes 318 (4.7) 280 (4.2) 269 (4.0) 174 (2.6) 154 (2.3)
  No 6 456 (95.3) 6 388 (95.8) 6 462 (96.0) 6 524 (97.4) 6 563 (97.7)
Diabetes, n (%) 62.14 < 0.001
  Yes 271 (4.0) 240 (3.6) 168 (2.5) 147 (2.2) 114 (1.7)
  No 6 503 (96.0) 6 428 (96.4) 6 563 (97.5) 6 551 (97.8) 6 603 (98.3)
Kidney disease, n (%) 14.35 0.006
  Yes 163 (2.4) 120 (1.8) 108 (1.6) 127 (1.9) 101 (1.5)
  No 6 611 (97.6) 6 548 (98.2) 6 623 (98.4) 6 571 (98.1) 6 616 (98.5)
Stroke, n (%) 101.74 < 0.001
  Yes 217 (3.2) 133 (2.0) 94 (1.4) 60 (0.9) 60 (0.9)
  No 6 557 (96.8) 6 535 (98.0) 6 637 (98.6) 6 638 (99.1) 6 657 (99.1)

Table 2

Associations of total physical activity with mortality risk in COPD patients"

Quintiles of total physical activity P
Q1 Q2 Q3 Q4 Q5
All-cause mortality
  Number of deaths, n 2 764 1 955 1 558 1 195 842
  Mortality rate/% 40.4 26.8 20.5 15.5 10.6
  Model 1, HR(95%CI) 1.00 0.83 (0.78, 0.88) 0.76 (0.70, 0.81) 0.69 (0.63, 0.74) 0.63 (0.58, 0.69) < 0.001
  Model 2, HR(95%CI) 1.00 0.90 (0.84, 0.95) 0.85 (0.79, 0.91) 0.78 (0.72, 0.85) 0.77 (0.70, 0.85) < 0.001
Vascular disease mortality
  Number of deaths, n 1 069 749 506 372 244
  Mortality rate/% 15.6 10.3 6.7 4.8 3.1
  Model 1, HR(95%CI) 1.00 0.81 (0.74, 0.89) 0.75 (0.66, 0.84) 0.73 (0.63, 0.84) 0.66 (0.56, 0.77) < 0.001
  Model 2, HR(95%CI) 1.00 0.88 (0.80, 0.97) 0.83 (0.73, 0.93) 0.82 (0.71, 0.94) 0.77 (0.65, 0.91) 0.002
Malignant tumor mortality
  Number of deaths, n 619 470 383 327 287
  Mortality rate/% 9.1 6.4 5.1 4.2 3.6
  Model 1, HR(95%CI) 1.00 1.01 (0.90, 1.15) 0.91 (0.79, 1.05) 0.88 (0.75, 1.03) 0.88 (0.74, 1.04) 0.105
  Model 2, HR(95%CI) 1.00 1.03 (0.91, 1.16) 0.94 (0.82, 1.09) 0.91 (0.77, 1.08) 0.92 (0.78, 1.10) 0.293
Respiratory disease mortality
  Number of deaths, n 702 493 427 288 165
  Mortality rate/% 10.3 6.8 5.6 3.7 2.1
  Model 1, HR(95%CI) 1.00 0.74 (0.66, 0.83) 0.61 (0.53, 0.70) 0.45 (0.38, 0.53) 0.37 (0.31, 0.46) < 0.001
  Model 2, HR(95%CI) 1.00 0.86 (0.76, 0.97) 0.76 (0.66, 0.87) 0.58 (0.49, 0.69) 0.58 (0.48, 0.71) < 0.001

Table 3

Subgroup analysis for the associations of total physical activity with all-cause mortality risk in COPD patients"

Quintiles of total physical activity P(LR χ2)
Q1 Q2 Q3 Q4 Q5
Age group/years 0.028 (7.12)
  30- 1.00 1.19 (0.76, 1.86) 1.06 (0.68, 1.65) 1.02 (0.66, 1.59) 1.15 (0.75, 1.77)
  50- 1.00 0.88 (0.73, 1.06) 0.86 (0.71, 1.04) 0.81 (0.67, 0.99) 0.81 (0.66, 0.99)
  60- 1.00 0.90 (0.84, 0.96) 0.85 (0.79, 0.92) 0.79 (0.72, 0.87) 0.77 (0.68, 0.86)
Area 0.125 (2.35)
  Rural 1.00 0.89 (0.83, 0.96) 0.85 (0.78, 0.92) 0.79 (0.72, 0.86) 0.75 (0.68, 0.83)
  Urban 1.00 0.93 (0.84, 1.04) 0.88 (0.77, 1.01) 0.80 (0.65, 0.97) 0.86 (0.70, 1.06)
Gender 0.012 (6.24)
  Male 1.00 0.90 (0.83, 0.97) 0.90 (0.82, 0.98) 0.83 (0.75, 0.92) 0.81 (0.73, 0.91)
  Female 1.00 0.86 (0.78, 0.95) 0.77 (0.68, 0.87) 0.67 (0.58, 0.77) 0.64 (0.53, 0.76)
Smoking status 0.109 (2.57)
  Non-current smoker 1.00 0.91 (0.83, 0.99) 0.82 (0.74, 0.92) 0.76 (0.67, 0.86) 0.71 (0.61, 0.82)
  Current daily smoker 1.00 0.88 (0.81, 0.96) 0.86 (0.78, 0.95) 0.79 (0.71, 0.88) 0.79 (0.70, 0.89)
Drinking status 0.004 (8.12)
  Non-current weekly drinker 1.00 0.92 (0.86, 0.98) 0.86 (0.80, 0.93) 0.78 (0.71, 0.85) 0.77 (0.69, 0.86)
  Current weekly drinker 1.00 0.74 (0.62, 0.87) 0.75 (0.63, 0.89) 0.74 (0.61, 0.89) 0.71 (0.58, 0.87)
Sedentary/(h/d) 0.158 (1.99)
   < 3 1.00 0.91 (0.82, 1.00) 0.83 (0.75, 0.93) 0.78 (0.68, 0.88) 0.75 (0.66, 0.86)
  ≥3 1.00 0.88 (0.81, 0.95) 0.85 (0.77, 0.93) 0.78 (0.70, 0.87) 0.78 (0.68, 0.89)
GOLD 0.016 (8.32)
  1 1.00 0.92 (0.78, 1.09) 0.84 (0.69, 1.03) 0.76 (0.60, 0.95) 0.76 (0.60, 0.97)
  2 1.00 0.95 (0.87, 1.04) 0.95 (0.85, 1.06) 0.91 (0.81, 1.04) 0.87 (0.76, 1.00)
  3-4 1.00 0.82 (0.75, 0.90) 0.74 (0.66, 0.82) 0.66 (0.58, 0.74) 0.64 (0.55, 0.75)
BMI/(kg/m2) 0.003 (14.30)
  Underweight 1.00 0.86 (0.75, 0.99) 0.78 (0.66, 0.92) 0.64 (0.53, 0.78) 0.57 (0.45, 0.71)
  Normal weight 1.00 0.88 (0.81, 0.95) 0.80 (0.73, 0.89) 0.73 (0.65, 0.81) 0.71 (0.63, 0.80)
  Overweight 1.00 0.86 (0.75, 0.98) 0.81 (0.69, 0.96) 0.91 (0.75, 1.11) 0.77 (0.61, 0.96)
  Obese 1.00 1.02 (0.78, 1.33) 1.08 (0.81, 1.44) 0.60 (0.39, 0.91) 0.80 (0.49, 1.32)
Self-assessed health status 0.010 (11.34)
  Excellent 1.00 0.99 (0.78, 1.24) 0.91 (0.69, 1.20) 0.90 (0.65, 1.23) 0.95 (0.68, 1.33)
  Good 1.00 0.87 (0.75, 1.02) 0.82 (0.69, 0.98) 0.78 (0.64, 0.95) 0.70 (0.57, 0.86)
  Average 1.00 0.87 (0.80, 0.95) 0.87 (0.78, 0.96) 0.78 (0.69, 0.88) 0.73 (0.63, 0.84)
  Poor 1.00 0.85 (0.76, 0.95) 0.71 (0.62, 0.81) 0.61 (0.53, 0.71) 0.58 (0.48, 0.71)

Figure 1

Associations between different intensities of physical activity and all-cause mortality risk in COPD patients LPA was divided into 5 parts according to quintiles, and the boundaries are 0-, 2.8-, 6.0-, 8.6-, 12.9-42.67 MET-hours/day; MVPA was divided into 5 parts according to quintiles, and the boundaries are 0-, 0.1-, 2.9-, 6.6-, 21.1-101.9 MET-hours/day; results are presented as HR (95%CI) and based on model 2. PA, physical activity; LPA low-level physical activity; MVPA moderate-to-vigorous-level physical activity; MET, metabolic equivalent of the task; COPD, chronic obstructive pulmonary disease."

Figure 2

Associations between different types of physical activity and all-cause mortality risk in COPD patients Occupational PA was divided into 5 parts according to quintiles, and the boundaries are 0-, 0.3-, 2.3-, 10.7-, 21.7-100 MET-hours/day; Non-occupational PA was divided into 5 parts according to quintiles, and the boundaries are 0-, 3.7-, 6.2-, 8.4-, 11.2-58.97 MET-hours/day; results are presented as HR (95%CI) and based on model 2. PA physical activity; MET, metabolic equivalent of the task; COPD, chronic obstructive pulmonary disease."

1
慢性阻塞性肺疾病急性加重诊治专家组. 慢性阻塞性肺疾病急性加重诊治中国专家共识[J]. 国际呼吸杂志, 2023, 43 (2): 132- 149.
2
Global Initiative for Chronic Obstructive Lung Disease (GOLD). Global strategy for the diagnosis, management, and prevention of chronic obstructive pulmonary disease: 2025 update[EB/OL]. (2025-01-01)[2025-01-15]. https://www.goldcopd.org.
3
Wang C , Xu J , Yang L , et al. Prevalence and risk factors of chronic obstructive pulmonary disease in China (the China Pulmonary Health [CPH] study): A national cross-sectional study[J]. Lancet, 2018, 391 (10131): 1706- 1717.

doi: 10.1016/S0140-6736(18)30841-9
4
Zhong N , Wang C , Yao W , et al. Prevalence of chronic obstructive pulmonary disease in China[J]. Am J Respir Crit Care Med, 2007, 176 (8): 753- 760.

doi: 10.1164/rccm.200612-1749OC
5
Chen S , Kuhn M , Prettner K , et al. The global economic burden of chronic obstructive pulmonary disease for 204 countries and territories in 2020-50: A health-augmented macroeconomic modelling study[J]. Lancet Glob Health, 2023, 11 (8): e1183- e1193.

doi: 10.1016/S2214-109X(23)00217-6
6
World Health Organization. WHO guidelines on physical activity and sedentary behaviour [EB/OL]. (2020-11-25)[2024-12-25]. https://www.who.int/publications/i/item/9789240015128.
7
Rabe KF , Watz H . Chronic obstructive pulmonary disease[J]. Lancet, 2017, 389 (10082): 1931- 1940.

doi: 10.1016/S0140-6736(17)31222-9
8
Chen Z , Chen J , Collins R , et al. China Kadoorie Biobank of 0.5 million people: Survey methods, baseline characteristics and long-term follow-up[J]. Int J Epidemiol, 2011, 40 (6): 1652- 1666.

doi: 10.1093/ije/dyr120
9
Chen Z , Lee L , Chen J , et al. Cohort profile: The kadoorie study of chronic disease in China (KSCDC)[J]. Int J Epidemiol, 2005, 34 (6): 1243- 1249.

doi: 10.1093/ije/dyi174
10
Ainsworth BE , Haskell WL , Herrmann SD , et al. 2011 compendium of physical activities: A second update of codes and MET values[J]. Med Sci Sports Exerc, 2011, 43 (8): 1575- 1581.

doi: 10.1249/MSS.0b013e31821ece12
11
樊萌语, 吕筠, 郭彧, 等. 中国慢性病前瞻性研究: 10个项目地区成人体力活动和休闲静坐时间特征差异的分析[J]. 中华流行病学杂志, 2015, 36 (8): 779- 785.
12
中华人民共和国国家卫生健康委员会医政司. 肥胖症诊疗指南(2024年版)[J]. 中华消化外科杂志, 2024, 23 (10): 1237- 1260.

doi: 10.3760/cma.j.cn115610-20241017-00455
13
Cheng SWM , McKeough Z , Alison J , et al. Associations of total and type-specific physical activity with mortality in chronic obstructive pulmonary disease: A population-based cohort study[J]. BMC Public Health, 2018, 18 (1): 268.

doi: 10.1186/s12889-018-5167-5
14
孙明希, 温启邦, 涂华康, 等. 4种慢性病共病模式及运动与全因死亡的相关性研究[J]. 中华流行病学杂志, 2022, 43 (12): 1952- 1958.
15
Waschki B , Kirsten A , Holz O , et al. Physical activity is the strongest predictor of all-cause mortality in patients with COPD: A prospective cohort study[J]. Chest, 2011, 140 (2): 331- 342.

doi: 10.1378/chest.10-2521
16
Garcia-Rio F , Rojo B , Casitas R , et al. Prognostic value of the objective measurement of daily physical activity in patients with COPD[J]. Chest, 2012, 142 (2): 338- 346.

doi: 10.1378/chest.11-2014
17
Kim T , Kim H , Kong S , et al. Association between regular moderate to vigorous physical activity initiation following COPD diagnosis and mortality: An emulated target trial using nationwide cohort data[J]. Chest, 2024, 165 (1): 84- 94.

doi: 10.1016/j.chest.2023.07.017
18
Moy ML , Gould MK , Liu IA , et al. Physical activity assessed in routine care predicts mortality after a COPD hospitalisation[J]. ERJ Open Res, 2016, 2 (1): 00062- 2015.
19
Yuan LD , Zhang LH , Wang Y , et al. The impact of leisure-time physical activity and sedentary behavior on mortality in patients with chronic obstructive pulmonary disease[J]. Am J Phys Med Rehabil, 2025, 104 (4): e49- e57.

doi: 10.1097/PHM.0000000000002612
20
Kontro TK , Sarna S , Kaprio J , et al. The difference in risk of chronic pulmonary disease morbidity and mortality between former elite athletes and ordinary men in Finland[J]. Eur J Sport Sci, 2020, 20 (8): 1140- 1149.

doi: 10.1080/17461391.2019.1697375
21
Loprinzi PD , Sng E , Walker JF . Muscle strengthening activity associates with reduced all-cause mortality in COPD[J]. Chronic Illn, 2017, 13 (2): 140- 147.
22
MacDonald DM , Samorodnitsky S , Lock EF , et al. Biomarkers of inflammation and longitudinal evaluation of lung function, physical activity, and grip strength: A secondary analysis in the CASCADE study[J]. Chronic Obstr Pulm Dis, 2024, 11 (4): 396- 405.
23
Obling N , Backer V , Hurst JR , et al. Nasal and systemic inflammation in chronic obstructive pulmonary disease (COPD)[J]. Respir Med, 2022, 195, 106774.
24
Ito JT , Alves LHV , Oliveira LDM , et al. Effect of exercise trai-ning on modulating the TH17/TREG imbalance in individuals with severe COPD: A randomized controlled trial[J]. Pulmonology, 2025, 31 (1): 2441069.
25
Wang XS , Liu C , Liang RN , et al. Elucidating the beneficial impact of exercise on chronic obstructive pulmonary disease and its comorbidities: Integrating proteomic and immunological insights[J]. Br J Pharmacol, 2024, 181 (24): 5133- 5150.
26
Nymand SB , Hartmann JP , Ryrsø CK , et al. Exercise adaptations in COPD: The pulmonary perspective[J]. Am J Physiol Lung Cell Mol Physiol, 2022, 323 (6): L659- L666.
27
Hu YZ, Sun QF, Han YT, et al. Role of lifestyle factors on the development and long-term prognosis of pneumonia and cardiovascular disease in the Chinese population[J]. Chin Med J (Engl), 2024, 8 (2024-08-28)[2024-12-26]. https://pubmed.ncbi.nlm.nih.gov/39193696.
[1] Chang LIU, Zhao LI, Lei JIN, Chunyi LIU, Chunjing WANG, Jie ZHANG, Lei JIN. Association between maternal periconceptional supplementation of folic acid or multiple micronutrients containing folic acid and perinatal mortality rate [J]. Journal of Peking University (Health Sciences), 2025, 57(3): 473-480.
[2] Yuxin WANG, Ru CAO, Jing HUANG, Ponsawansong Pitakchon, Tawatsupa Benjawan, Xiaochuan PAN, Prapamontol Tippawan, Guoxing LI. Impact of fine particulate matter exposure on non-accidental mortality under different apparent temperature levels [J]. Journal of Peking University (Health Sciences), 2024, 56(5): 820-827.
[3] Qingxin ZHOU,Qingqing YANG,Shuyuan SHI,Pei LI,Feng SUN. Association between serum uric acid and airflow obstruction based on the health-checkup population [J]. Journal of Peking University (Health Sciences), 2024, 56(4): 693-699.
[4] Shan CAI,Yihang ZHANG,Ziyue CHEN,Yunfe LIU,Jiajia DANG,Di SHI,Jiaxin LI,Tianyu HUANG,Jun MA,Yi SONG. Status and pathways of factors influencing physical activity time among elementary and junior high school students in Beijing [J]. Journal of Peking University (Health Sciences), 2024, 56(3): 403-410.
[5] Zi-kai WANG,Jia-li MO,Meng ZHANG,Ji-ping LIAO. Epidemiology and hospitalization costs analysis of female inpatients with acute exacerbation of chronic obstructive pulmonary disease in Beijing from 2013 to 2020 [J]. Journal of Peking University (Health Sciences), 2023, 55(6): 1074-1081.
[6] Ya-nan ZHAO,Hui-yun FAN,Xiang-yu WANG,Ya-nan LUO,Rong ZHANG,Xiao-ying ZHENG. Early death and causes of death of patients with autism spectrum disorders: A systematic review [J]. Journal of Peking University (Health Sciences), 2023, 55(2): 375-383.
[7] Yun-fei LIU,Jia-jia DANG,Pan-liang ZHONG,Ning MA,Di SHI,Yi SONG. Injury mortality among Chinese aged 5 to 24 years from 1990 to 2019 [J]. Journal of Peking University (Health Sciences), 2022, 54(3): 498-504.
[8] Yi-hua LIU,Qing-ping YUN,Lan-chao ZHANG,Xiao-yue ZHANG,Yu-ting LIN,Fang-jing LIU,Zhi-jie ZHENG,Chun CHANG. Joint association of sedentary behavior and physical activity on anxiety tendency among occupational population in China [J]. Journal of Peking University (Health Sciences), 2022, 54(3): 490-497.
[9] LIU Jie,GUO Chao. A prospective cohort study of the influence of positive/negative effectivity on the mortality risk of the Chinese elderly [J]. Journal of Peking University (Health Sciences), 2022, 54(2): 255-260.
[10] Xiao-na NA,Zhu ZHU,Yang-yang CHEN,Dong-ping WANG,Hao-jie WANG,Yang SONG,Xiao-chuan MA,Pei-yu WANG,Ai-ping LIU. Associations of distribution of time spent in physical activity and sedentary behavior with obesity [J]. Journal of Peking University (Health Sciences), 2020, 52(3): 486-491.
[11] Yi SONG,Dong-mei LUO,Pei-jin HU,Xiao-jin YAN,Jing-shu ZHANG,Yuan-ting LEI,Bing ZHANG,Jun MA. Trends of prevalence of excellent health status and physical fitness among Chinese Han students aged 13 to 18 years from 1985 to 2014 [J]. Journal of Peking University (Health Sciences), 2020, 52(2): 317-322.
[12] Hai-rong BAO,Xiao-ju LIU,En-li TAN,Juan SHU,Ji-yuan DONG,Sheng LI. Effects of temperature and relative humidity on the number of outpatients with chronic obstructive pulmonary disease and their interaction effect in Lanzhou, China [J]. Journal of Peking University (Health Sciences), 2020, 52(2): 308-316.
[13] Wen TANG,Jun-yi GAO,Xin-yu MA,Chao-he ZHANG,Lian-tao MA,Ya-sha WANG. Application of recurrent neural network in prognosis of peritoneal dialysis [J]. Journal of Peking University(Health Sciences), 2019, 51(3): 602-608.
[14] Jiang XIE,Fei LI. Association of sleep overlap syndrome with type 2 diabetes in a cross-sectional study [J]. Journal of Peking University(Health Sciences), 2019, 51(2): 252-255.
[15] WU Shi-yan1, ZHANG Xu-xi1, SUN Kai-ge1, HU Kang, LIU Si-jia, SUN Xin-ying. Application of multi-group structural equation model in comparative study of HBM related to recreational physical activity among population with high risk of chronic diseases and healthy people [J]. Journal of Peking University(Health Sciences), 2018, 50(4): 711-716.
Viewed
Full text


Abstract

Cited

  Shared   
  Discussed   
No Suggested Reading articles found!