Journal of Peking University (Health Sciences) ›› 2020, Vol. 52 ›› Issue (3): 500-505. doi: 10.19723/j.issn.1671-167X.2020.03.016

Previous Articles     Next Articles

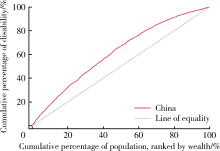
Research on equity and influencing factors of disability among Chinese middle-aged and old people

Zhe-bin WANG,Zhi-jie ZHENG()   

  1. Department of Global Health, Peking University School of Public Health, Beijing 100191, China
  • Received:2020-02-17 Online:2020-06-18 Published:2020-06-30
  • Contact: Zhi-jie ZHENG E-mail:zhengzj@bjmu.edu.cn
  • Supported by:
    National Natural Science Foundation of China(71904004)

Abstract:

Objective: To evaluate disability status and equity of the middle-aged and old population in China, and to explore the influencing factors contributing to the inequity of disability.Methods: This study was based on data collected from the first wave survey (2007—2010) of World Health Organization Study on Global Ageing and Adult Health (SAGE). Concentration index (CI) and concentration curve were calculated to measure the economic-related inequity of disability among the Chinese middle-aged and old people. The CI was further decomposed in which the attributions of social and individual determinants were calculated.Results: The mean score of the World Health Organization Disability Assessment Sche-dule (WHODAS) was 7.32 among the Chinese middle-aged and old people, 6.37 for males and 8.21 for females. The CI for the whole participants was -0.190 9, compared with -0.184 4 for the middle-aged and old men and -0.196 1 for the women. After decomposition of the CI, socioeconomic status contributed most to disability inequity among the Chinese middle-aged and old population. Financial status, educational level and work type contributed 66.41%, 16.45% and 13.10% respectively to inequity of disability. Individual lifestyle factors, including tobacco use, alcohol consumption and physical activities, contributed less to inequity of disability compared with social structural determinants.Conclusion: There was inequity of disability among Chinese middle-aged and old population, and those with better financial status were less likely to suffer from functional disability. Middle-aged and old males were less disabled than females, and had less inequity of disability. Financial status, educational level and work type took the highest contribution to inequity of disability among Chinese middle-aged and old population, suggesting that promoting healthy lifestyles alone cannot effectively reduce the inequity of disability. The government needs to continually strengthen and improve appropriate social and medical protection measures on the basis of the importance it attaches to the health of the middle-aged and old population, and makes reducing health inequities a policy priority. The government should pay attention to the provision of healthcare and other resources in areas where development is relatively lagging and where there is a relative concentration of middle-aged and old population. Meanwhile, there should be more significant support for research on health status and equity among the middle-aged and old population to obtain more evidence for proactive responses to rapid population aging in China and policy development.

Key words: Middle-aged and old people, Disability, Equity, Concentration index

CLC Number: 

  • R197.1

Table 2

Concentration index of disability among Chinese middle-aged and old people"

Items Concentration index 95% confidence interval
All -0.190 9 -0.335 7 to -0.046 1
Male -0.184 4 -0.329 3 to -0.039 6
Female -0.196 1 -0.340 8 to -0.051 4

Table 1

Distribution and WHODAS scores among different demographic characteristics in Chinese middle-aged and old population"

Variables Percentage WHODAS score, x?±s
Average WHODAS score n=11 656 7.32±10.76
Gender
Male 48.40% 6.37±10.23
Female 51.60% 8.21±11.16
Age/years
50-59 43.39% 4.32±6.86
60-69 29.94% 6.91±9.40
70-79 21.24% 11.17±13.27
80 and above 5.42% 18.42±18.10
Economic status
Lowest 20.00% 11.74±13.12
Low and middle 20.00% 8.68±11.34
Middle 20.01% 7.43±10.65
Middle and high 20.00% 5.52±8.84
Highest 20.00% 3.21±6.70
Education
Beyond college/university 4.18% 3.10±7.03
High school 11.80% 3.90±7.17
Junior high school 19.54% 4.69±8.06
Primary school 20.35% 6.57±9.67
Less than primary school 18.57% 7.30±9.44
No formal education 25.56% 12.19±13.95
Employment
Never work 12.06% 11.11±12.83
Public 35.66% 5.39±8.81
Private 8.85% 4.56±8.43
Self 41.00% 8.41±11.55
Informal 2.42% 8.24±11.02
Residence
Urban 46.48% 6.01±9.70
Rural 53.52% 8.45±11.48
Marital status
Currently married 82.99% 6.42±9.78
Other marital status 17.01% 11.68±13.82
Household size
Single 10.84% 9.59±11.98
Two person 46.53% 7.39±10.56
Three persons 18.77% 6.40±10.37
Four persons and above 23.87% 6.85±10.72
Medical insurance
With medical insurance 87.91% 7.10±10.77
No medical insurance 12.09% 8.87±10.56
Tobacco use
Never smoke 66.35% 7.65±10.91
Not current smoker 6.42% 8.24±13.21
Smoker, not daily 2.43% 6.81±11.48
Current daily smoker 24.80% 6.24±9.43
Alcohol consumption
Never drink 69.00% 7.86±11.19
Infrequent drinker 10.21% 8.04±12.20
Frequent drinker 20.79% 5.19±8.00
Physical activity
High level 39.96% 5.63±7.67
Moderate level 28.23% 6.24±8.85
Low level 31.81% 10.39±14.38

Figure 1

Concentration curve for disability among Chinese population"

Table 3

Contribution percentages of determinates to concentration index among Chinese middle-aged and old people"

Variables Contribution percentages
All Male Female
Financial status 65.58% 76.25% 55.36%
Education 16.56% 11.84% 19.02%
Employment 12.90% 12.99% 10.58%
Residence 10.66% 2.23% 20.79%
Marital status 3.78% 3.38% 4.17%
Household size -1.46% -0.79% -0.71%
Medical insurance -0.21% -1.13% 0.65%
Tobacco use -0.26% 0.12% -1.43%
Alcohol consumption 0.32% 0.34% 0.22%
Physical activity -4.95% -5.29% -4.48%
[1] World Health Organization. World report on ageing and health [R]. Geneva: World Health Organization, 2015: 246.
[2] Jones GW. Ageing in China, India and Indonesia: an overview[M] // Contemporary demographic transformations in China, India and Indonesia. Berlin: Springer, 2016: 325-328.
[3] United Nations. Department of economic and social affairs, population division (2013), world population ageing 2013[M]. New York: United Nations publication, 2013.
[4] Crimmins EM, Beltrán-Sánchez H. Mortality and morbidity trends: is there compression of morbidity?[J]. J Gerontol B Psychol Sci Soc Sci, 2011,66(1):75-86.
pmid: 21135070
[5] Wang XQ, Chen PJ. Population ageing challenges health care in China[J]. Lancet, 2014,383(9920):870.
[6] Du P, Wang Y. Population ageing and the development of social care service systems for older persons in China[J]. Int J Ageing Dev C, 2016,1(1):40-52.
[7] Chen X, Huang B, Li S. Population ageing and inequality: Evidence from China[J]. World Economy, 2018,41(8):1976-2000.
[8] Fan C, Ouyang W, Tian L, et al. Elderly health inequality in China and its determinants: a geographical perspective[J]. Int J Environ Res Public Health, 2019,16(16):2953.
[9] Zhong Y, Wang J, Nicholas S. Gender, childhood and adult socioeconomic inequalities in functional disability among Chinese older adults[J]. Int J Equity Health, 2017,16(1):165.
[10] Yang L, Konttinen H, Martikainen P, et al. Socioeconomic status and physical functioning: a longitudinal study of older Chinese people[J]. J Gerontol B Psychol Sci Soc Sci, 2018,73(7):1315-1329.
pmid: 28329825
[11] International Health Conference. Constitution of the World Health Organization. 1946[J]. Bull World Health Organ, 2002,80(12):983-984.
[12] O’Donnell O, Doorslaer EV, Wagstaff A, et al. Analyzing health equity using household survey data: A guide to techniques and their implementation[J]. World Bank, 2008,86(10):816-816.
[13] Üstuün TB, Ebrary I. Measuring health and disability: manual for WHO Disability Assessment Schedule WHODAS 2.0 [R]. Geneva: World Health Organization, 2010.
[14] Murray CJL, Evans DB. Health systems performance assessment: Debates, methods and empiricism[M]. Geneva: World Health Organization, 2003.
[15] Bull FC, Maslin TS, Armstrong T. Global physical activity questionnaire (GPAQ): nine country reliability and validity study[J]. J Phys Act Health, 2009,6(6):790-804.
doi: 10.1123/jpah.6.6.790 pmid: 20101923
[16] Armstrong T, Bull F. Development of the World Health Organization Global Physical Activity Questionnaire (GPAQ)[J]. J Public Health, 2006,14(2):66-70.
[17] van Doorslaer E, Koolman X. Explaining the differences in income—related health inequalities across European countries[J]. Health Econ, 2004,13(7):609-628.
pmid: 15259042
[18] Macinko J, Harris MJ, Rocha MG. Brazil’s National Program for Improving Primary Care Access and Quality (PMAQ): fulfilling the potential of the world’s largest payment for performance system in primary care[J]. J Ambul Care Manage, 2017,40(2 Suppl):S4-S11.
[19] 赵梓行. 均等化视角下印度医疗服务体系管理研究[D]. 湖南: 湘潭大学, 2018.
[20] Adriano M, Thomas H, Gomes LFA, et al. The Brazilian health system at crossroads: progress, crisis and resilience[J]. BMJ Global Health, 2018,3(4):e000829.
[21] Balarajan Y, Selvaraj S, Subramanian SV. Health care and equity in India[J]. Lancet, 2011,377(9764):505-515.
pmid: 21227492
[22] Sharma JK, Narang R. Quality of healthcare services in rural India: the user perspective[J]. Vikalpa, 2011,36(1):51-60.
[1] ZHANG Lei, ZHU Lei, LI Zhi-Heng, LI Jin-Zhou, PAN Hong-Wei, ZHANG Shao-Feng, QIN Wen-Hua, HE Li-Hua. Analysis on the disease burden and its impact factors of coal worker’s pneumoconiosis inpatients [J]. Journal of Peking University(Health Sciences), 2014, 46(2): 226-231.
Viewed
Full text


Abstract

Cited

  Shared   
  Discussed   
[1] Author. English Title Test[J]. Journal of Peking University(Health Sciences), 2010, 42(1): 1 -10 .
[2] . [J]. Journal of Peking University(Health Sciences), 2009, 41(2): 188 -191 .
[3] . [J]. Journal of Peking University(Health Sciences), 2009, 41(3): 376 -379 .
[4] . [J]. Journal of Peking University(Health Sciences), 2009, 41(4): 459 -462 .
[5] . [J]. Journal of Peking University(Health Sciences), 2010, 42(1): 82 -84 .
[6] . [J]. Journal of Peking University(Health Sciences), 2007, 39(3): 319 -322 .
[7] . [J]. Journal of Peking University(Health Sciences), 2007, 39(3): 333 -336 .
[8] . [J]. Journal of Peking University(Health Sciences), 2007, 39(3): 337 -340 .
[9] . [J]. Journal of Peking University(Health Sciences), 2007, 39(3): 225 -328 .
[10] . [J]. Journal of Peking University(Health Sciences), 2007, 39(4): 346 -350 .