北京大学学报(医学版) ›› 2024, Vol. 56 ›› Issue (3): 390-396. doi: 10.19723/j.issn.1671-167X.2024.03.003
儿童早期体重指数轨迹与超重风险关联的前瞻性队列研究
岳芷涵1,韩娜2,鲍筝2,吕瑾莨1,周天一1,计岳龙1,王辉1,刘珏3,王海俊1,*( )
)
- 1. 北京大学公共卫生学院妇幼卫生学系,北京 100191
2. 北京市通州区妇幼保健院,北京 101101
3. 北京大学公共卫生学院流行病与卫生统计学系,北京 100191
A prospective cohort study of association between early childhood body mass index trajectories and the risk of overweight
Zhihan YUE1,Na HAN2,Zheng BAO2,Jinlang LYU1,Tianyi ZHOU1,Yuelong JI1,Hui WANG1,Jue LIU3,Haijun WANG1,*()
- 1. Department of Maternal and Child Health, Peking University School of Public Health, Beijing 100191, China
2. Tongzhou Maternal and Child Health Hospital of Beijing, Beijing 101101, China
3. Department of Epidemiology and Biostatistics, Peking University School of Public Health, Beijing 100191, China
摘要:
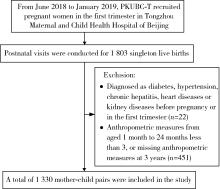
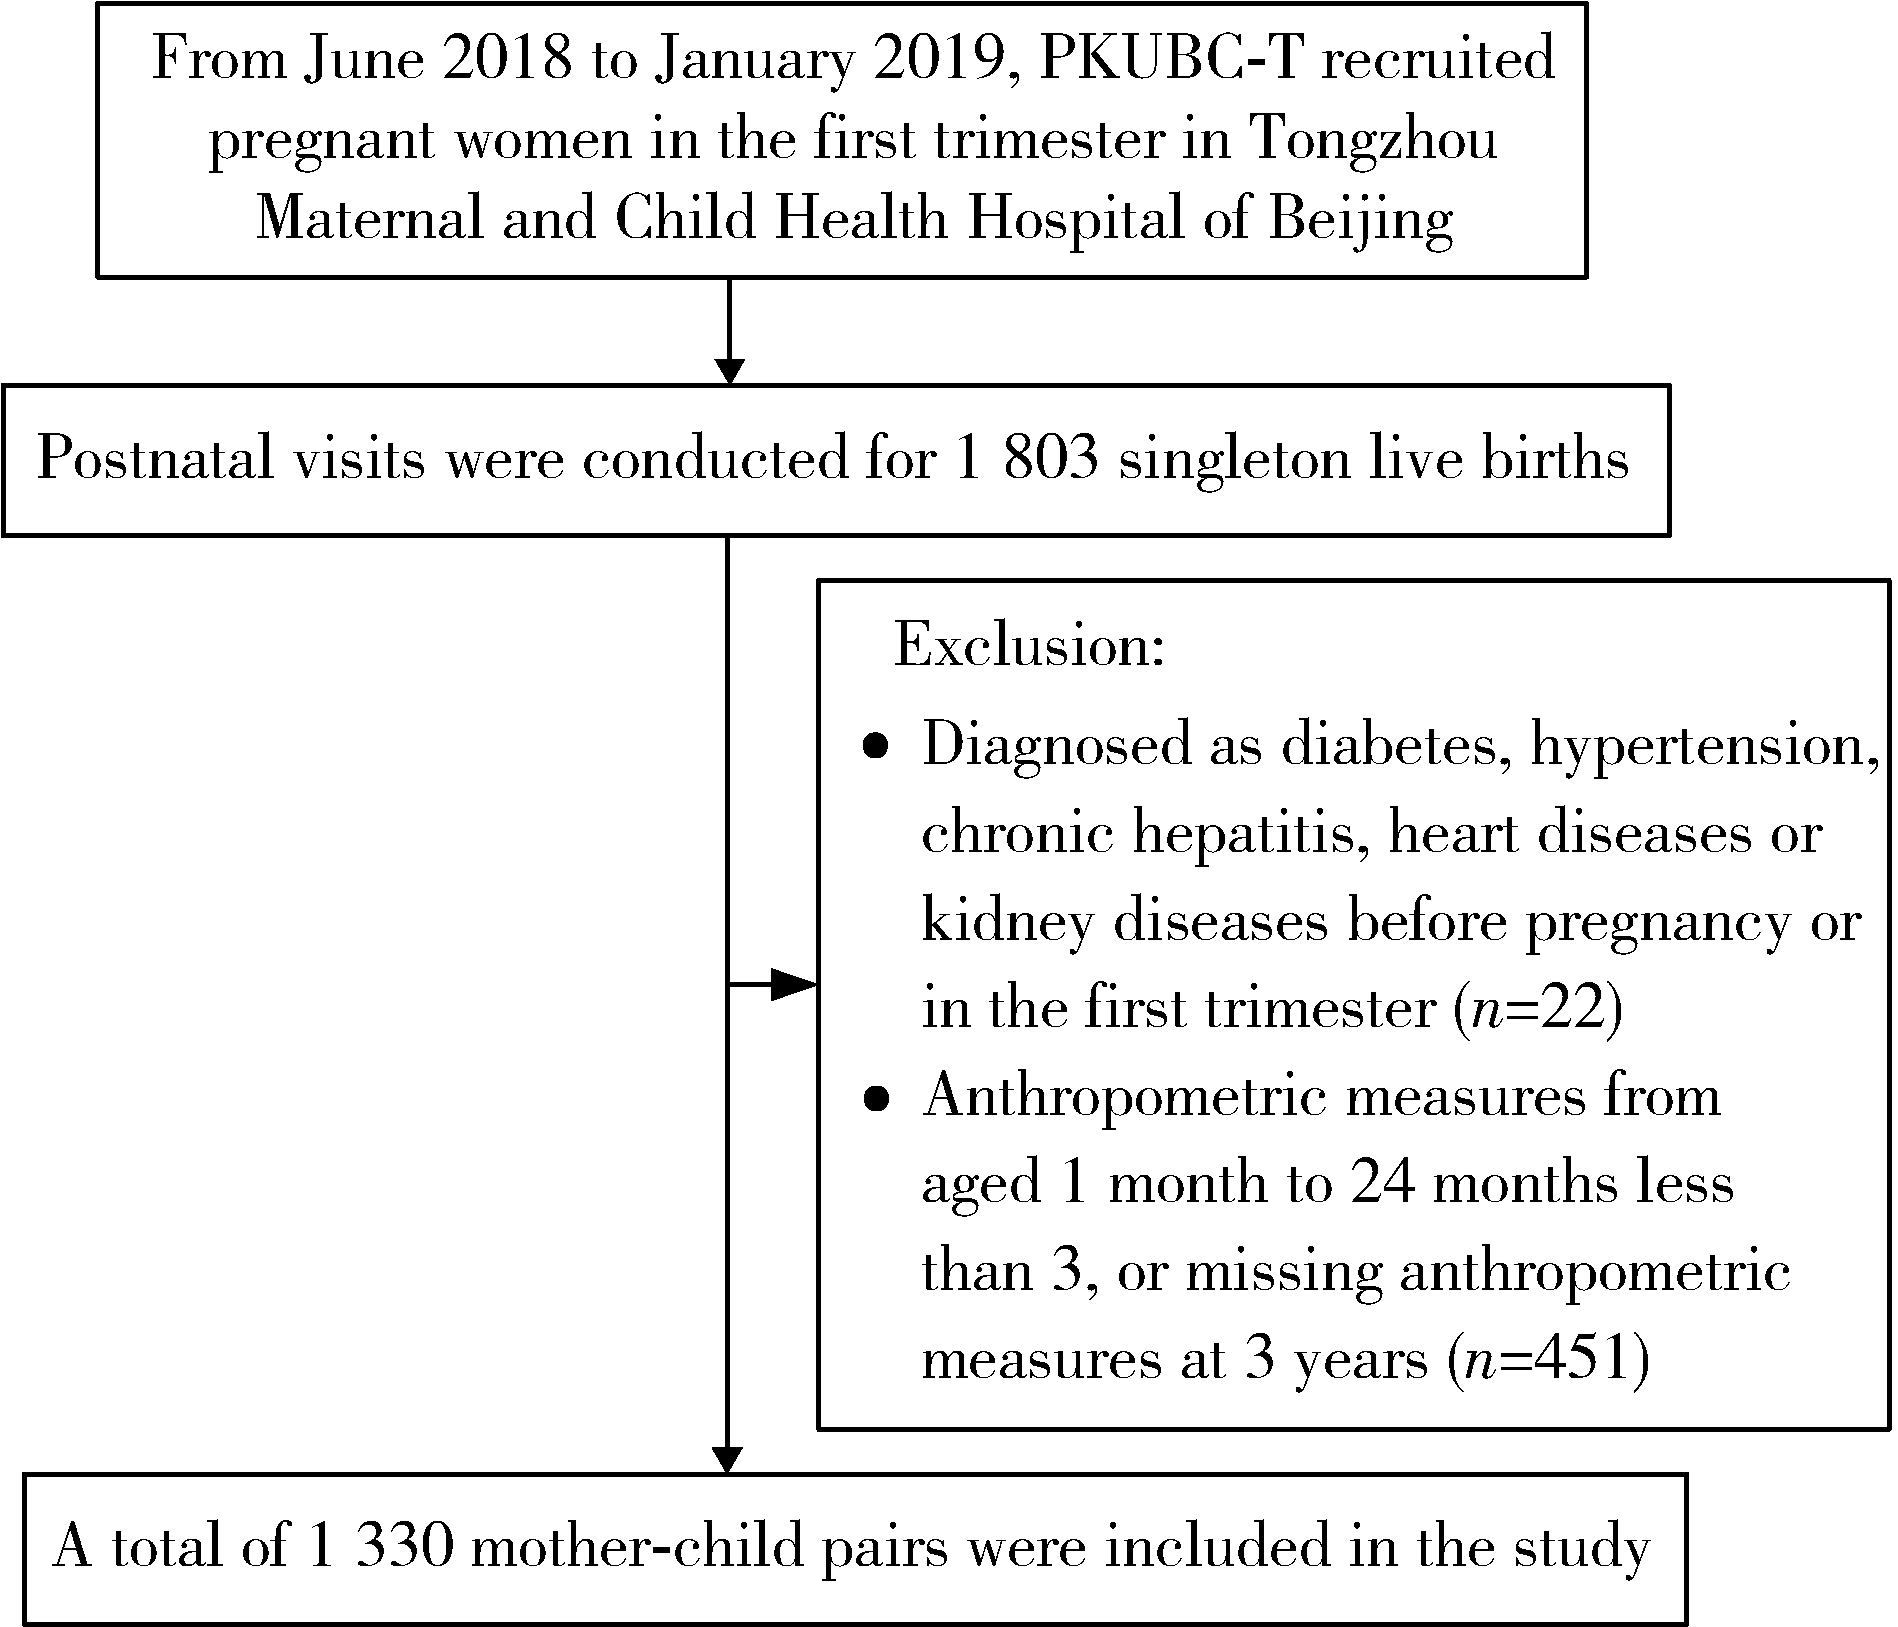
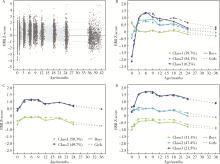
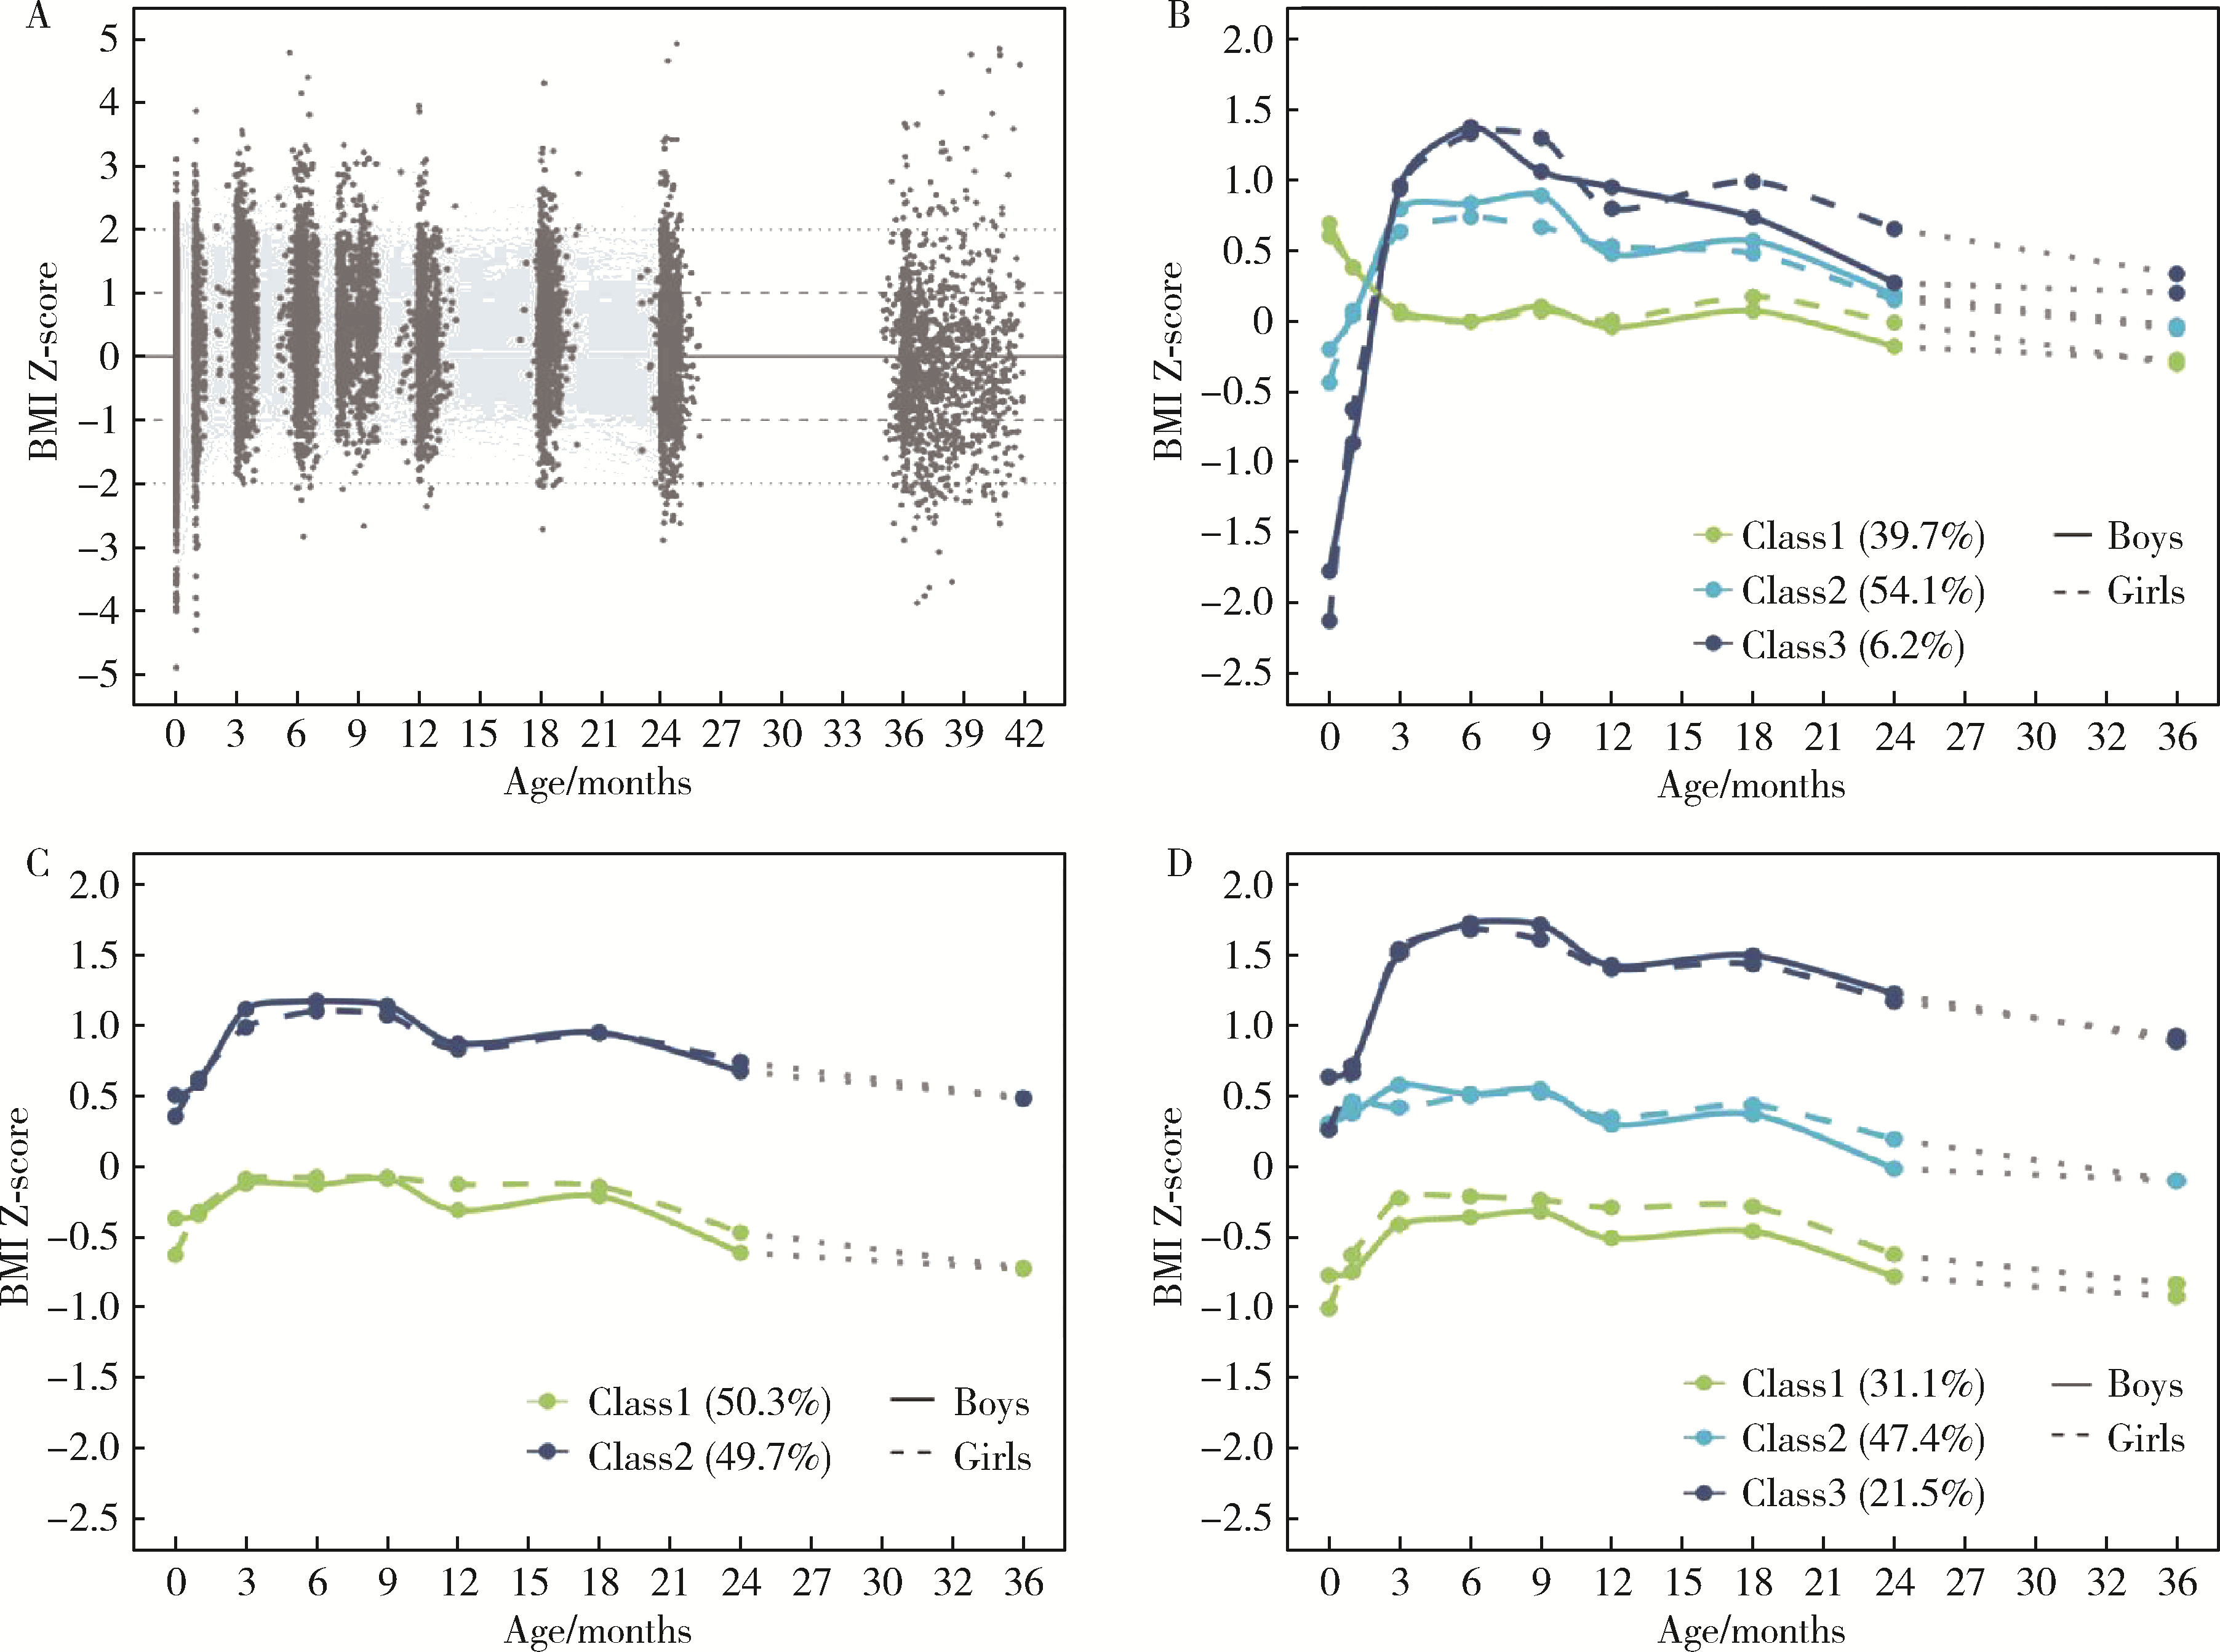
目的: 基于前瞻性队列比较不同方法确定的儿童早期体重指数(body mass index, BMI)轨迹与超重风险的关联,识别在儿童早期生长发育重要窗口期具有较高肥胖风险的人群。方法: 共纳入北大通州出生队列的1 330名儿童,分别在儿童刚出生, 1、3、6、9、12、18、24月龄和3岁进行随访,根据其身长/身高和体质量计算BMI Z评分。应用潜类别增长混合模型(growth mixture modelling, GMM)和基于纵向数据的k-means聚类方法(k-means for longitudinal data, KML)分析儿童早期(从出生至24月龄)BMI轨迹分组,采用线性回归比较不同方法确定的儿童早期BMI轨迹和儿童3岁时BMI Z评分的关联,通过五折交叉验证的平均受试者工作特征曲线下面积,比较Logistic回归模型中不同方法确定的儿童早期BMI轨迹分组对儿童3岁超重风险(BMI Z评分>1)的预测性能。结果: 在纳入的研究对象中,用GMM确定的三分类轨迹分为低、中、高轨迹,分别占39.7%、54.1%、6.2%;用KML方法确定的二分类轨迹分为低轨迹和高轨迹,分别占50.3%和49.7%;用KML方法确定的三分类轨迹分为低、中、高轨迹,分别占31.1%、47.4%、21.5%。用不同方法确定的儿童早期BMI轨迹反映的生长模式存在一定差异。线性回归分析发现,在调整母亲民族、受教育水平、分娩方式、产次、分娩时年龄、分娩孕周、胎儿性别和1月龄母乳喂养等协变量后,用KML方法确定的三分类轨迹中的高轨迹组(表现为出生时BMI Z评分略高、婴儿期快速生长后持续稳定在高水平的生长模式)和儿童3岁BMI Z评分的关联最强。Logistic回归分析发现,KML三分类轨迹分组对儿童3岁超重风险具有最佳的预测效果。在额外调整儿童平衡膳食指数正端分、平均每天身体活动时间和视屏时间后,结果基本一致。结论: 采用不同方法识别具有不同变化特征的儿童早期BMI轨迹,发现KML方法确定的高轨迹组能更好地发现儿童早期具有较高超重风险的人群,为选择适宜方法开展儿童早期BMI轨迹相关研究提供了依据。
中图分类号:
- R179
| 1 |
Barker DJ . The fetal and infant origins of adult disease[J]. BMJ, 1990, 301 (6761): 1111.
doi: 10.1136/bmj.301.6761.1111 |
| 2 |
Geserick M , Vogel M , Gausche R , et al. Acceleration of BMI in early childhood and risk of sustained obesity[J]. N Engl J Med, 2018, 379 (14): 1303- 1312.
doi: 10.1056/NEJMoa1803527 |
| 3 |
Yuan Y , Chu C , Zheng WL , et al. Body mass index trajectories in early life is predictive of cardiometabolic risk[J]. J Pediatr, 2020, 219, 31-37, e36.
doi: 10.1016/j.jpeds.2019.12.060 |
| 4 | Aris IM , Bernard JY , Chen LW , et al. Infant body mass index peak and early childhood cardio-metabolic risk markers in a multi-ethnic Asian birth cohort[J]. Int J Epidemiol, 2017, 46 (2): 513- 525. |
| 5 |
den Dekker HT , Jaddoe VWV , Reiss IK , et al. Fetal and infant growth patterns and risk of lower lung function and asthma. The generation R study[J]. Am J Respir Crit Care Med, 2018, 197 (2): 183- 192.
doi: 10.1164/rccm.201703-0631OC |
| 6 |
Mattsson M , Maher GM , Boland F , et al. Group-based trajectory modelling for BMI trajectories in childhood: A systematic review[J]. Obes Rev, 2019, 20 (7): 998- 1015.
doi: 10.1111/obr.12842 |
| 7 |
Cao T , Zhao J , Hong X , et al. Cord blood metabolome and BMI trajectory from birth to adolescence: A prospective birth cohort study on early life biomarkers of persistent obesity[J]. Metabolites, 2021, 11 (11): 739.
doi: 10.3390/metabo11110739 |
| 8 |
Meir AY , Huang W , Cao T , et al. Umbilical cord DNA methylation is associated with body mass index trajectories from birth to adolescence[J]. EBioMedicine, 2023, 91, 104550.
doi: 10.1016/j.ebiom.2023.104550 |
| 9 |
Jin C , Lin L , Han N , et al. Effects of dynamic change in fetuin-A levels from the first to the second trimester on insulin resistance and gestational diabetes mellitus: A nested case-control study[J]. BMJ Open Diabetes Res Care, 2020, 8 (1): e000802.
doi: 10.1136/bmjdrc-2019-000802 |
| 10 | World Health Organization. WHO child growth standards: Length/height-for-age, weight-for-age, weight-for-length, weight-for-height and body mass index-for-age: Methods and development [R]. Geneva: World Health Organization, 2006. |
| 11 |
de Onis M , Lobstein T . Defining obesity risk status in the general childhood population: Which cut-offs should we use[J]. Int J Pediatr Obes, 2010, 5 (6): 458- 460.
doi: 10.3109/17477161003615583 |
| 12 | World Health Organization, the United Nations Children' s Fund (UNICEF). Indicators for assessing infant and young child feeding practices: Definitions and measurement methods [R]. Geneva: World Health Organization and the United Nations Children' s Fund (UNICEF), 2021. |
| 13 | 房玥晖, 何宇纳, 李春丽. 基于中国学龄前儿童平衡膳食指数的2010—2012年中国学龄前儿童膳食质量评价[J]. 中华预防医学杂志, 2020, 54 (6): 662- 667. |
| 14 |
Wen LM , van der Ploeg HP , Kite J , et al. A validation study of assessing physical activity and sedentary behavior in children aged 3 to 5 years[J]. Pediatr Exerc Sci, 2010, 22 (3): 408- 420.
doi: 10.1123/pes.22.3.408 |
| 15 | Proust-Lima C , Philipps V , Liquet B . Estimation of extended mixed models using latent classes and latent processes: The R package lcmm[J]. J Stat Softw, 2017, 78 (2): 1- 56. |
| 16 | Genolini C , Alacoque X , Sentenac M , et al. kml and kml3d: R packages to cluster longitudinal data[J]. J Stat Softw, 2015, 65 (4): 1- 34. |
| 17 |
Stekhoven DJ , Bühlmann P . MissForest: Non-parametric missing value imputation for mixed-type data[J]. Bioinformatics, 2012, 28 (1): 112- 118.
doi: 10.1093/bioinformatics/btr597 |
| 18 |
Hu Z , Tylavsky FA , Han JC , et al. Maternal metabolic factors during pregnancy predict early childhood growth trajectories and obesity risk: The CANDLE study[J]. Int J Obes (Lond), 2019, 43 (10): 1914- 1922.
doi: 10.1038/s41366-019-0326-z |
| 19 |
Montazeri P , Vrijheid M , Martinez D , et al. Maternal metabolic health parameters during pregnancy in relation to early childhood BMI trajectories[J]. Obesity (Silver Spring), 2018, 26 (3): 588- 596.
doi: 10.1002/oby.22095 |
| 20 |
Michael N , Gupta V , Fogel A , et al. Longitudinal characterization of determinants associated with obesogenic growth patterns in early childhood[J]. Int J Epidemiol, 2023, 52 (2): 426- 439.
doi: 10.1093/ije/dyac177 |
| 21 | 李春刚, 严双琴, 高国朋, 等. 母亲孕期饮食模式与儿童早期BMI变化轨迹关联的队列研究[J]. 中华流行病学杂志, 2023, 44 (11): 1769- 1775. |
| 22 | Xiong C , Chen K , Xu LL , et al. Associations of prenatal exposure to bisphenols with BMI growth trajectories in offspring within the first two years: Evidence from a birth cohort study in China[J]. World J Pediatr, 2023, 2023-11-29 (2024-02-01) |
| 23 | Nguena Nguefack HL , Pagé MG , Katz J , et al. Trajectory modelling techniques useful to epidemiological research: A comparative narrative review of approaches[J]. Clin Epidemiol, 2020, 12, 1205- 1222. |
| 24 | Den Teuling NGP , Pauws SC , van den Heuvel ER . A comparison of methods for clustering longitudinal data with slowly changing trends[J]. Commun Stat Simul Comput, 2023, 52 (3): 621- 648. |
| 25 | Huang W , Meir AY , Olapeju B , et al. Defining longitudinal trajectory of body mass index percentile and predicting childhood obesity: Methodologies and findings in the Boston birth cohort[J]. Precis Nutr, 2023, 2 (2): e00037. |
| [1] | 李萍, 王海雪, 高晓, 韩亚静, 王辉, 王海俊, 牟莹莹. 基于移动健康技术对超重或肥胖孕妇体重管理的随机对照试验[J]. 北京大学学报(医学版), 2025, 57(3): 465-472. |
| [2] | 陈敬,单蕊,肖伍才,张晓蕊,刘峥. 青春期和成年早期自制力与抑郁症状和超重肥胖共病风险的关联:基于全国调查的十年前瞻性队列研究[J]. 北京大学学报(医学版), 2024, 56(3): 397-402. |
| [3] | 吴一凡,玉应香,谢岚,张志达,常翠青. 不同体重指数青年男性的静息能量消耗特点及预测方程评价[J]. 北京大学学报(医学版), 2024, 56(2): 247-252. |
| [4] | 党佳佳,蔡珊,钟盼亮,王雅琪,刘云飞,师嫡,陈子玥,张依航,胡佩瑾,李晶,马军,宋逸. 室外夜间人工光暴露与中国9~18岁儿童青少年超重肥胖的关联[J]. 北京大学学报(医学版), 2023, 55(3): 421-428. |
| [5] | 刘杰,郭超. 正/负性情绪对中国老年人死亡风险影响的前瞻性队列研究[J]. 北京大学学报(医学版), 2022, 54(2): 255-260. |
| [6] | 董彦会,宋逸,董彬,邹志勇,王政和,杨招庚,王西婕,李艳辉,马军. 2014年中国7~18岁学生血压状况与营养状况的关联分析——基于中国儿童青少年血压评价标准[J]. 北京大学学报(医学版), 2018, 50(3): 422-428. |
| [7] | 程兰,李钦,宋逸,马军,王海俊. 中国9~11岁小学生体育锻炼、静态行为和#br# 超重与肥胖的关系[J]. 北京大学学报(医学版), 2016, 48(3): 436-441. |
| [8] | 谢高强1△, 于晖2, 陈敬洲2, 赵连成3△, 任福秀4, 史平4, 武阳丰1, 5, 6. 基因变异及心血管危险因素与单核细胞分泌白细胞介素6和10的关系[J]. 北京大学学报(医学版), 2014, 46(4): 589-595. |
| [9] | 付连国, 马军, 王海俊, 董彬, 王晶晶, 尚晓瑞, 张子龙, 刘芳宏, 蔡赐河, 文晗. 儿童青少年超重、肥胖对其身体机能影响的 多水平分析[J]. 北京大学学报(医学版), 2012, 44(3): 359-363. |
|
||
