
1 资料与方法
1.1 研究对象
1.2 观察指标
1.3 统计学分析
2 结果
2.1 基本情况
表1 自发sIUFD组和选择性减胎组的一般情况比较Table 1 Comparison of general situations between the spontaneous sIUFD group and the selective feticide group |
| Variables | Spontaneous sIUFD group (n=120) | Selective feticide group (n=99) | P |
| Age/years, M (P25, P75) | 30.00 (27.00, 32.75) | 31.00 (29.00, 34.00) | 0.013a |
| BMI/(kg/m2), M (P25, P75) | 21.89 (19.52, 24.83) | 21.88 (19.96, 24.22) | 0.968a |
| Conception method, n (%) | 0.669b | ||
| Spontaneous pregnancy | 107 (89.2) | 90 (90.9) | |
| Assisted reproduction | 13 (10.8) | 9 (9.1) | |
| Parity, n (%) | 0.130b | ||
| Primipara | 90 (75.0) | 65 (65.7) | |
| Multipara | 30 (25.0) | 34 (34.3) | |
| Hypertensive disorders of pregnancy, n (%) | 18 (15.0) | 18 (18.2) | 0.527b |
| Gestational diabetes mellitus, n (%) | 11 (9.2) | 19 (19.2) | 0.032b |
| Other comorbidities, n (%) | 23 (19.2) | 21 (21.2) | 0.707b |
a, Mann-Whitney U test for quantitative data; b, Pearson Chi-square test for qualitative data. BMI, body mass index; sIUFD, single intrauterine fetal demise. |
2.2 胎儿合并症及宫内死亡情况
表2 自发sIUFD组和选择性减胎组胎儿合并症及胎儿宫内死亡情况Table 2 Fetal complications and stillbirth conditions in the spontaneous sIUFD group and the selective feticide group |
| Variables | Spontaneous sIUFD group (n=120) | Selective feticide group (n=99) | P |
| Fetal complications, n (%) | < 0.001a | ||
| TTTS | 41 (34.2) | 14 (14.1) | |
| sIUGR | 23 (19.2) | 29 (29.3) | |
| TRAPs | 2 (1.7) | 19 (19.2) | |
| MTFDA | 4 (3.3) | 15 (15.2) | |
| Multiple | 19 (15.8) | 19 (19.2) | |
| None | 31 (25.8) | 3 (3.0) | |
| Gestational weeks of sIUFD/feticide/weeks, M(P25,P75) | 26.78 (22.71, 30.57) | 21.64 (18.96, 24.71) | < 0.001b |
| < 28 gestational weeks, n (%) | 71 (59.2) | 98 (99.0) | < 0.001a |
| Location of the dead fetus, n (%) | 0.213a | ||
| Lower | 77 (66.4) | 72 (74.2) | |
| Higher | 39 (33.6) | 25 (25.8) |
a, Pearson Chi-square test for qualitative data; b, Mann-Whitney U test for quantitative data. sIUFD, single intrauterine fetal demise; TTTS, twin-to-twin transfusion syndrome; sIUGR, selective intrauterine growth restriction; TRAPs, twin reversed arterial perfusion; MTFDA, monochorionic twins discordant for fetal anomaly. |
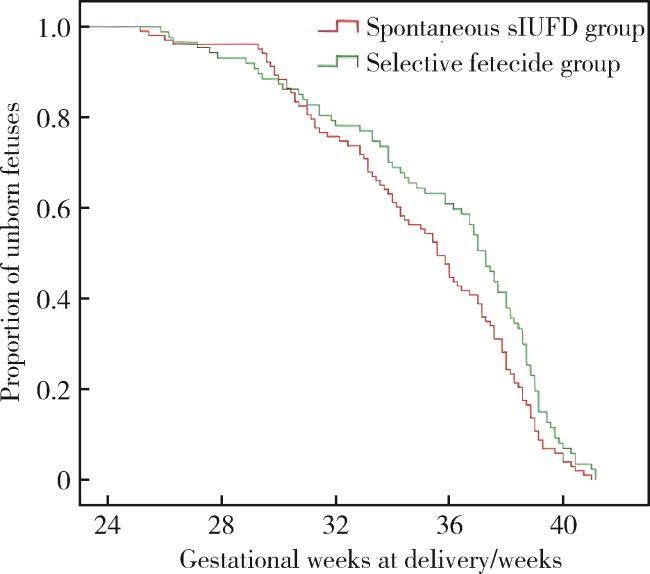
2.3 妊娠结局比较
表3 自发sIUFD组与选择性减胎组活产胎儿的妊娠结局Table 3 Pregnancy outcomes of live-born fetuses in the spontaneous sIUFD group and the selective feticide group |
| Variables | Spontaneous sIUFD group (n=102) | Selective feticide group (n=81) | P |
| Cesarean section, n (%) | 45 (44.1) | 39 (48.1) | 0.587a |
| Gestational week of delivery/weeks, M (P25, P75) | 35.71 (32.36, 38.04) | 37.43 (33.86, 38.93) | 0.014b |
| PPROM, n (%) | 18 (17.5) | 19 (21.8) | 0.449c |
| Preterm birth/weeks, n (%) | |||
| < 30 | 10 (9.8) | 5 (6.2) | 0.374a |
| < 32 | 24 (23.5) | 13 (16.0) | 0.211a |
| < 33 | 37 (36.3) | 21 (25.9) | 0.135a |
| < 37 | 60 (58.8) | 34 (42.0) | 0.024a |
| Transferred to NICU, n (%) | 42 (41.2) | 33 (40.7) | 0.953a |
| Neonatal asphyxia, n (%) | 14 (13.7) | 1 (1.2) | 0.002a |
| Neonatal birth weight/g, M (P25, P75) | 2 295.00 (1 660.00, 2 962.50) | 2 690.00 (1 880.00, 3 090.00) | 0.064b |
| Small for gestational age infant, n (%) | 35 (34.3) | 22 (27.2) | 0.299a |
| Early neonatal death, n (%) | 14 (13.7) | 0 (0) | 0.001a |
| Abnormal neonatal cranial ultrasound, n (%) | 25 (24.5) | 19 (23.5) | 0.868a |
a, Pearson Chi-Square test for qualitative and ordinal data; b, Mann-Whitney U test for quantitative data. sIUFD, single intrauterine fetal demise; PPROM, preterm premature rupture of membranes; NICU, neonatal intensive care unit. |
2.4 影响存活儿结局的因素分析
表4 影响妊娠结局的风险因素分析Table 4 Analysis of risk factors affecting pregnancy outcomes |
| Variables | Gestational weeks of delivery, HR (95%CI) | Preterm birth (< 37 weeks), OR (95%CI) | Viable fetus died in utero, OR (95%CI) | Abnormal neonatal cranial ultrasound, OR (95%CI) |
| Age | 0.984(0.911-1.062) | |||
| Hypertensive disorders of pregnancy | 1.644 (1.116-2.423)* | 2.072 (0.839-5.117) | ||
| Gestational diabetes mellitus | 0.564 (0.177-1.799) | |||
| Selective feticide | 1.102 (0.727-1.672) | 2.298 (0.912-5.791) | 0.333 (0.141-0.788)* | 2.505 (0.906-6.924) |
| Gestational weeks of fetal death | 1.070 (1.034-1.107)▲ | 1.204 (1.107-1.310)▲ | 0.934 (0.863-1.009) | 1.129 (1.034-1.232)# |
| Dead fetus lies lower | 2.232 (1.047-4.760)* | |||
| TTTS | 1.359 (0.842-2.193) | 1.838 (0.648-5.213) | 9.524 (2.025-44.798)# | 1.840 (0.600-5.645) |
| TRAPs | 0.789 (0.399-1.558) | 0.400 (0.085-1.884) | 8.964 (1.369-58.681)* | 0.234 (0.022-2.450) |
| sIUGR | 0.783 (0.264-2.322) | 0.706 (0.233-2.141) | 7.138 (1.364-37.342)* | 0.642 (0.189-2.176) |
| MTFDA | 0.627 (0.130-3.028) | 0.727 (0.144-3.671) | 10.506 (1.638-67.394)* | 1.027 (0.195-5.397) |
| Multiple complications | 1.464 (0.467-4.592) | 1.322 (0.414-4.223) | 7.292 (1.401-37.943)* | 0.765 (0.210-2.785) |
*P < 0.05; #P < 0.01; ▲P < 0.001. TTTS, twin-to-twin transfusion syndrome; TRAPs, twin reversed arterial perfusion; sIUGR, selective intrauterine growth restriction; MTFDA, monochorionic twins discordant for fetal anomaly. |
