
1 资料与方法
1.1 患者基本资料
1.2 临床、影像和病理参数
1.3 统计学分析
2 结果
2.1 患者临床资料比较
表1 盆腔淋巴结转移组和非转移组的临床资料比较Table 1 Comparison of clinical characteristics between pelvic lymph node metastasis and non-metastasis groups |
| Parameter | Total (n=344) | Pelvic lymph node metastasis | Statistic | P | |
| Positive (n=77) | Negative (n=267) | ||||
| Age/years, M (P25, P75) | 68 (64, 73) | 68 (64, 73) | 68 (64, 75) | Z=-0.39 | 0.699 |
| BMI/(kg/m2), M (P25, P75) | 24.9 (23.0, 26.7) | 25.4 (23.7, 26.6) | 24.8 (22.9, 26.8) | Z=-0.71 | 0.475 |
| tPSA/(ng/mL), M (P25, P75) | 19.5 (11.6, 50.4) | 48.5 (24.2, 100.0) | 16.8 (10.1, 34.3) | Z=-6.44 | < 0.001 |
| fPSA/(ng/mL), M (P25, P75) | 2.28 (1.13, 5.57) | 5.28 (2.71, 11.90) | 1.68 (0.99, 4.02) | Z=-6.03 | < 0.001 |
| fPSA/tPSA, M (P25, P75) | 0.103 (0.074, 0.150) | 0.121 (0.082, 0.175) | 0.098 (0.071, 0.148) | Z=-2.59 | 0.01 |
| PSAD/(ng/mL2), M (P25, P75) | 0.62 (0.33, 1.24) | 1.08 (0.61, 2.18) | 0.54 (0.28, 0.95) | Z=-4.90 | < 0.001 |
| Volume/mL, M (P25, P75) | 40 (29, 59) | 46 (34, 71) | 38 (28, 55) | Z=-2.30 | 0.021 |
| Positive biopsy cores/%, M (P25, P75) | 0.63 (0.38, 1.00) | 1.00 (0.92, 1.00) | 0.53 (0.29, 0.85) | Z=-7.84 | < 0.001 |
| PI-RADS score, n (%) | χ2=31.77 | < 0.001 | |||
| ≤2 | 25 (7.27) | 0 (0) | 25 (9.36) | ||
| 3 | 65 (18.90) | 1 (1.30) | 64 (23.97) | ||
| ≥4 | 254 (73.84) | 76 (98.70) | 178 (66.67) | ||
| Biopsy Gleason score, n (%) | χ2=42.01 | < 0.001 | |||
| 3+3 | 48 (13.95) | 3 (3.90) | 45 (16.85) | ||
| 3+4 | 65 (18.90) | 7 (9.09) | 58 (21.72) | ||
| 4+3 | 74 (21.51) | 7 (9.09) | 67 (25.09) | ||
| ≥8 | 157 (45.64) | 60 (77.92) | 97 (36.33) | ||
| Clinical T stage, n (%) | χ2=47.16 | < 0.001 | |||
| ≤T2 | 249 (72.38) | 32 (41.56) | 217 (81.27) | ||
| >T2 | 95 (27.62) | 45 (58.44) | 50 (18.73) | ||
| MRI-LNI, n (%) | χ2=75.97 | < 0.001 | |||
| N0 | 284 (82.56) | 38 (49.35) | 246 (92.13) | ||
| N1 | 60 (17.44) | 39 (50.65) | 21 (7.87) | ||
Z, Mann-Whitney test, χ2, Chi-square test. BMI, body mass index; tPSA, total prostate specific antigen; fPSA, free prostate specific antigen; fPSA/tPSA, fPSA to tPSA ratio; PSAD, prostate specific antigen density; PI-RADS, prostate imaging reporting and data system; MRI-LNI, MRI-indicated lymph node involvement. |
2.2 训练集与验证集的基线特征比较
表2 训练集与验证集的基线特征比较Table 2 Comparison of baseline characteristics between training and validation cohort |
| Characteristic | Training cohort (n=241) | Validation cohort (n=103) | Statistic | P |
| Age/years, M (P25, P75) | 69 (64, 73) | 68 (64, 74) | Z=-0.05 | 0.959 |
| BMI/(kg/m2), M (P25, P75) | 25.0 (22.8, 26.8) | 4.5 (23.5, 25.9) | Z=-0.35 | 0.726 |
| tPSA/(ng/mL), M (P25, P75) | 19.1 (11.1, 47.7) | 20.2 (13.1, 51.7) | Z=-0.88 | 0.376 |
| fPSA/(ng/mL), M (P25, P75) | 2.41 (1.07, 5.39) | 2.20 (1.28, 6.12) | Z=-0.52 | 0.606 |
| Positive biopsy cores/%, M (P25, P75) | 0.62 (0.39, 1.00) | 0.63 (0.38, 0.92) | Z=-0.78 | 0.433 |
| Volume/mL, M (P25, P75) | 39.0 (29.0, 55.0) | 43.0 (27.5, 61.5) | Z=-0.66 | 0.511 |
| PSAD/(ng/mL2), M (P25, P75) | 0.63 (0.32, 1.23) | 0.62 (0.33, 1.25) | Z=-0.09 | 0.929 |
| fPSA/tPSA, M (P25, P75) | 0.10 (0.08, 0.14) | 0.11 (0.07, 0.16) | Z=-0.001 | 0.999 |
| PI-RADS score, n (%) | χ2=0.09 | 0.955 | ||
| ≤2 | 17 (7.05) | 8 (7.77) | ||
| 3 | 45 (18.67) | 20 (19.42) | ||
| ≥4 | 179 (74.27) | 75 (72.82) | ||
| Biopsy Gleason score, n (%) | χ2=3.17 | 0.365 | ||
| 3+3 | 29 (12.03) | 19 (18.45) | ||
| 3+4 | 49 (20.33) | 16 (15.53) | ||
| 4+3 | 51 (21.16) | 23 (22.33) | ||
| ≥8 | 112 (46.47) | 45 (43.69) | ||
| Clinical T stage, n (%) | χ2=2.06 | 0.152 | ||
| ≤T2 | 169 (70.12) | 80 (77.67) | ||
| >T2 | 72 (29.88) | 23 (22.33) | ||
| MRI-LNI, n (%) | χ2=0.30 | 0.583 | ||
| N0 | 189 (78.42) | 78 (75.73) | ||
| N1 | 52 (21.58) | 25 (24.27) |
Abbreviations as in Table 1. |
2.3 训练集的单因素Logistic回归分析
表3 单因素与多因素Logistic回归分析训练集中预测PLNM的临床参数Table 3 Univariate and multivariate Logistic regression analyses of clinical parameters for predicting PLNM in the training cohort |
| Characteristic | Univariate analysis | Multivariable analysis | ||||||
| OR (95%CI) | Z | P | Coefficient | Z | OR (95%CI) | P | ||
| Age | 1.006 (0.957, 1.057) | 0.231 | 0.817 | |||||
| BMI | 1.093 (0.924, 1.294) | 1.039 | 0.299 | |||||
| tPSA | 1.007 (1.001, 1.014) | 2.315 | 0.021 | |||||
| fPSA | 1.099 (1.037, 1.166) | 3.171 | 0.002 | |||||
| fPSA/tPSA | 591.8 (4.3, 81 857.0) | 2.538 | 0.011 | |||||
| PSAD | 1.111 (0.926, 1.333) | 1.136 | 0.256 | |||||
| PV | 1.008 (0.998, 1.019) | 1.556 | 0.120 | |||||
| Positive biopsy cores | 232.4 (30.3, 1 780.0) | 5.245 | < 0.001 | 4.513 | 4.188 | 91.24 (13.34, 968.68) | < 0.001 | |
| PI-RADS score | 18.30 (2.56, 130.60) | 2.898 | 0.004 | 2.034 | 2.078 | 7.64 (1.78, 138.06) | 0.038 | |
| Biopsy Gleason score | ||||||||
| 3+3 | 1.000 (Reference) | |||||||
| 3+4 | 0.880 (0.138, 5.606) | -0.135 | 0.893 | |||||
| 4+3 | 1.149 (0.197, 6.692) | 0.154 | 0.877 | |||||
| ≥8 | 8.413 (1.904, 37.180) | 2.809 | 0.005 | |||||
| Clinical T stage | 0.150 (0.077, 0.291) | -5.594 | < 0.001 | |||||
| MRI-LNI | 9.268 (4.386, 19.580) | 5.834 | < 0.001 | 1.540 | 2.995 | 4.67 (1.74, 13.24) | 0.003 | |
Abbreviations as in Table 1. |
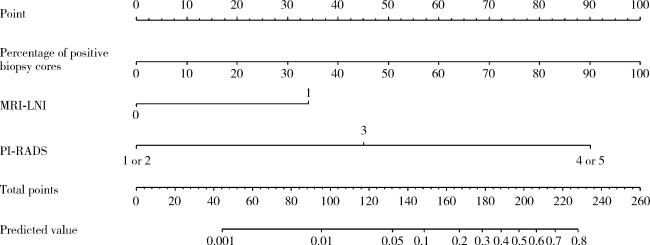
2.4 多因素Logistic回归分析以及预测列线图的构建
2.5 多因素模型的ROC、校准图和决策曲线
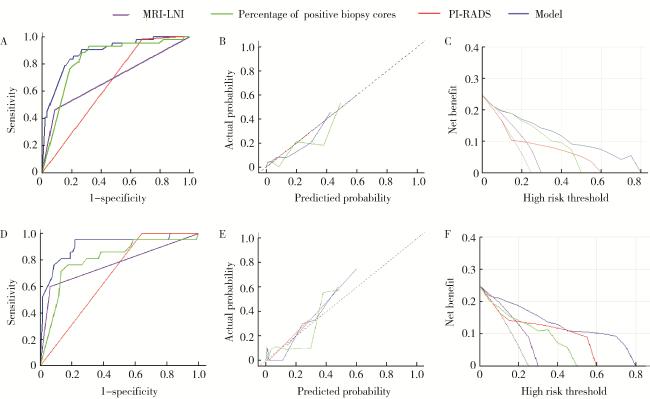
图2 MRI-LNI、PI-RADS、穿刺阳性针数百分比和多因素模型对于可疑PLNM的ROC、校准图和决策曲线分析Figure 2 ROC curve, calibration plots and DCA of MRI-LNI, PI-RADS, percentage of positive biopsy cores, and the multivariable model for suspected PLNM A, ROC curve in the training cohort; B, calibration plot in the training cohort; C, DCA in the training cohort; D, ROC curve in the validation cohort; E, calibration plot in the validation cohort; F, DCA in the validation cohort. ROC, receiver operating characteristic; DCA, decision curve analysis; PLNM, pelvic lymph node metastasis; PI-RADS, prostate imaging reporting and data system; MRI-LNI, MRI-indicated lymph node involvement. |
2.6 多因素模型在不同截断值时对PLNM的诊断表现
表4 多因素模型在不同截断值时对PLNM的诊断表现Table 4 Diagnostic performance of the multivariable model at different cutoff values for PLNM |
| Cutoff value | Below the cutoff (PLND not recommended), n (%) | Above the cutoff (PLND recommended), n (%) | |||||
| Total | Without PLNM | With PLNM | Total | Without PLNM | With PLNM | ||
| 2% | 92 (26.7) | 90 (97.8) | 2 (2.2) | 252 (73.3) | 177 (70.2) | 75 (29.8) | |
| 3% | 111 (32.3) | 108 (97.3) | 3 (2.7) | 233 (67.7) | 159 (68.2) | 74 (31.8) | |
| 4% | 120 (34.9) | 116 (96.7) | 4 (3.3) | 224 (65.1) | 151 (67.4) | 73 (32.6) | |
| 5% | 129 (37.5) | 125 (96.9) | 4 (3.1) | 215 (62.5) | 142 (66.0) | 73 (34.0) | |
| 6% | 143 (41.6) | 139 (97.2) | 4 (2.8) | 201 (58.4) | 128 (63.7) | 73 (36.3) | |
| 7% | 146 (42.4) | 141 (96.6) | 5 (3.4) | 198 (57.6) | 126 (63.6) | 72 (36.4) | |
| 8% | 159 (46.2) | 152 (95.6) | 7 (4.4) | 185 (53.7) | 115 (62.2) | 70 (37.8) | |
| 9% | 167 (48.5) | 159 (95.2) | 8 (4.8) | 177 (51.5) | 108 (61.0) | 69 (39.0) | |
| 10% | 182 (52.9) | 174 (95.6) | 8 (4.4) | 162 (47.1) | 93 (57.4) | 69 (42.6) | |
PLNM, pelvic lymph node metastasis; PLND, pelvic lymph node dissection. |
