
1 材料与方法
1.1 实验动物
1.2 实验试剂与仪器
表1 shRNA-Blimp1和shRNA-NC序列Table 1 The sequences of shRNA-Blimp1 and shRNA-NC |
| shRNA | Oligonucleotides (5′-3′) |
| shRNA-NC | CCGGCAACAAGATGAAGAGCACCAACTCGAGTTGGTGCTCTTCATCTT |
| shRNA-Blimp1-1 | AAAAGGTGCAGCCTTTATGAGTCCTCGAGGACTCATAAAGGCTGCACC |
| shRNA-Blimp1-2 | AAAACTCTCGACAGCAAATGGTTCTCGAGAACCATTTGCTGTCGAGAG |
| shRNA-Blimp1-3 | AAAAGCAGGATTACCCAAGAATACTCGAGTATTCTTGGGTAATCCTGC |
shRNA, short hairpin RNA; Blimp1, B lymphocyte induced maturation protein 1; NC, non-specific control. |
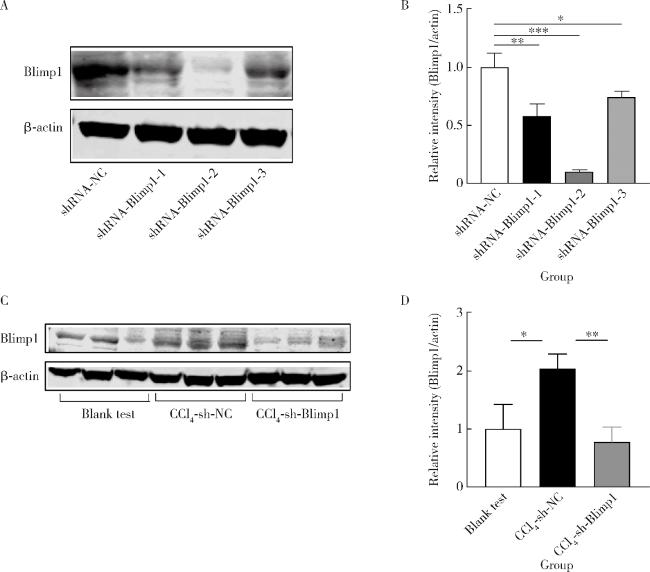
图1 RAW264.7细胞(A、B)和小鼠肝组织中(C、D)Blimp1表达水平Figure 1 Expression levels of Blimp1 in RAW264.7 cells(A, B) and the liver of mice(C, D) The interference efficiency of three shRNA-Blimp1 in RAW264.7 cells and the expression levels of Blimp1 in the liver of blank test, CCl4+AAV-shRNA-NC and CCl4+AAV-shRNA-Blimp1 group mice (n=10). *P < 0.05, **P < 0.01, ***P < 0.001. shRNA, short hairpin RNA; Blimp1, B lymphocyte induced maturation protein 1; CCl4, carbon tetrachloride; AAV, adeno-associated virus; NC, non-specific control; CCl4-sh-NC, CCl4+AAV-shRNA-NC group; CCl4-sh-Blimp1, CCl4+AAV-shRNA-Blimp1 group. |
1.3 溶液配制
1.4 动物分组、给药与造模
1.5 检测血清中ALT、AST
1.6 肝组织病理染色
1.7 Western blot检测蛋白表达水平
1.8 逆转录
1.9 Real-time PCR
1.10 统计学分析
2 结果
2.1 shRNA-Blimp1干扰效率与小鼠肝脏Blimp1表达水平
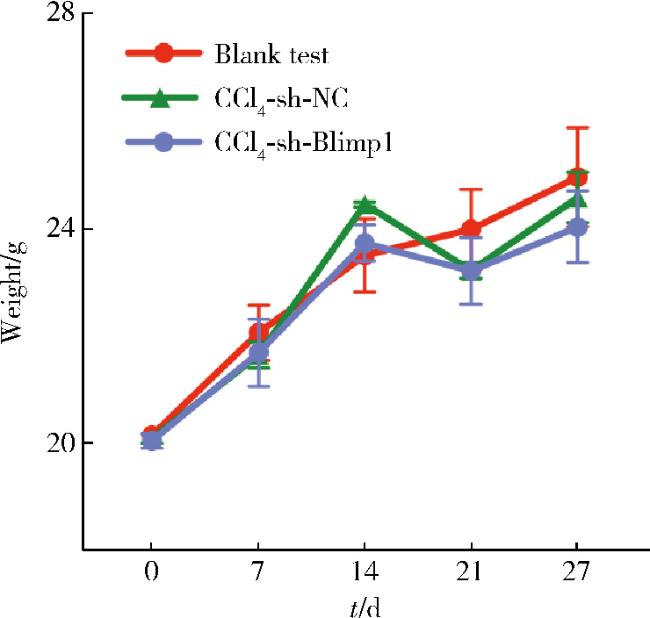
2.2 小鼠体重动力学变化
2.3 小鼠肝功能变化
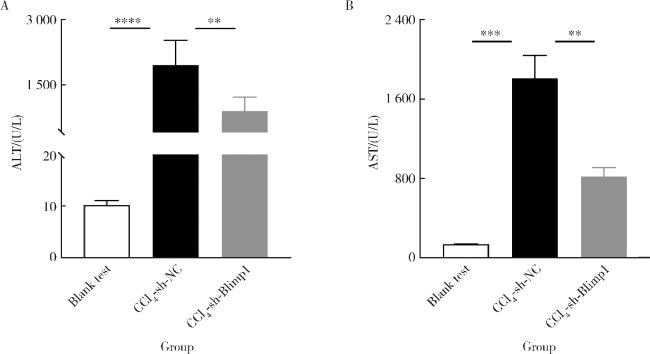
图3 各组小鼠血清ALT、AST水平Figure 3 The ALT and AST levels of serum in each group mice The ALT(A) and AST(B) levels of serum in the blank test, CCl4+AAV-shRNA-NC and CCl4+AAV-shRNA-Blimp1 group mice (n=10). **P < 0.01, ***P < 0.001, ****P < 0.000 1. AST, aspartate transaminase; ALT, alanine transaminase; Other abbreviations as in Figure 1. |
2.4 肝组织病理染色结果
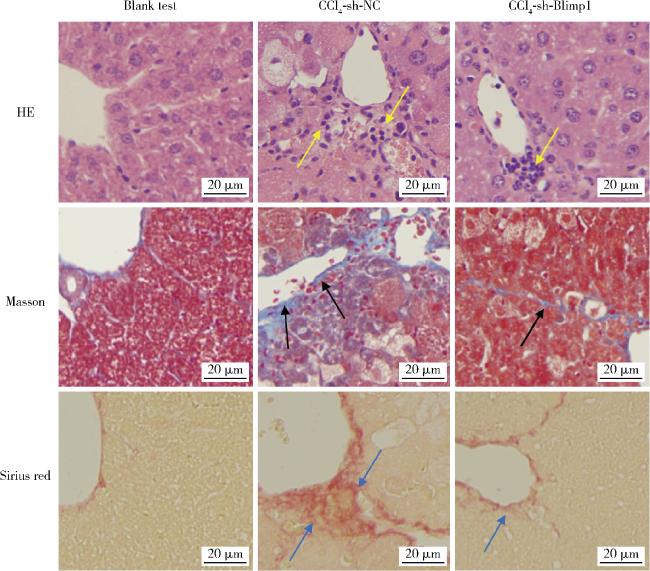
图4 各组小鼠肝组织病理染色Figure 4 Pathological staining of liver tissue in each group Pathological staining of liver tissue in the blank test, CCl4+AAV-shRNA-NC and CCl4+AAV-shRNA-Blimp1 group mice (n=10). The yellow arrows represent inflammatory infiltration, the black arrows represent collagen deposition, and the blue arrows represent liver fibrosis. HE, hematoxylin-eosin staining; Other abbreviations as in Figure 1. |
2.5 肝纤维化标志分子的变化情况
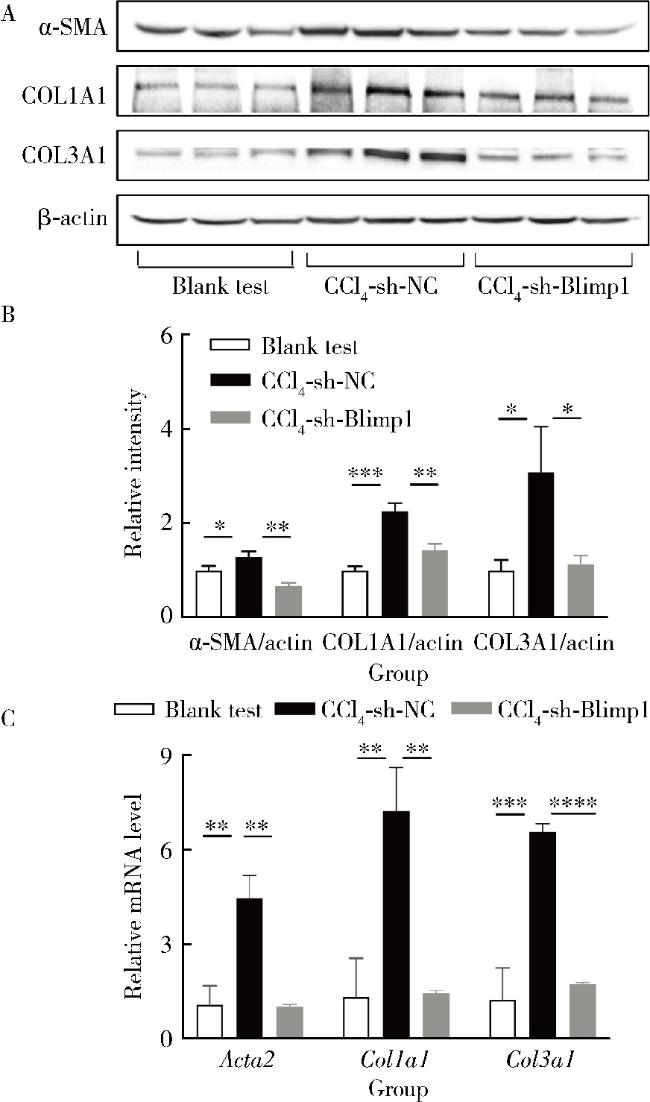
图5 各组小鼠肝脏α-SMA、COL1A1和COL3A1表达情况Figure 5 The α-SMA, COL1A1 and COL3A1 levels in liver of mice in each group A and B, the α-SMA, COL1A1 and COL3A1 levels in liver of mice in each group (n=10); C, the mRNA levels of Acta2, Col1a1 and Col3a1 in liver of mice in each group (n=10). * P < 0.05, **P < 0.01, ***P < 0.001, ****P < 0.000 1. The Acta2, Col1a1 and Col3a1 is the coding gene of α-SMA, COL1A1 and COL3A1, respectively. Abbreviations as in Figure 1. |
