
1 资料与方法
1.1 组织标本来源和免疫组织化学检测
1.2 人皮肤原代成纤维细胞分离
1.3 细胞培养
1.4 细胞转染和分组
1.5 实时荧光定量PCR
表1 IL-6、TNF-α、PRSS23引物序列Table 1 Primer sequences for IL-6, TNF-α and PRSS23 |
| Gene | GenBank ID | Primer sequences (5′ to 3′) | Length/bp |
| IL-6 | NM_000600 | Forward: 5′-ACTCACCTCAGAACGAATTG-3′ Reversed: 5′-CCATCTTGGAAGGTTCAGGTTG-3′ | 149 |
| TNF-α | NM_000594 | Forward: 5′-CCTCTAATCAGCCTCTG-3′ Reversed: 5′-GAGGACCTGGAGTAGAG-3′ | 220 |
| PRSS23 | NM_009104 | Forward: 5′-TGTGCTGGGCAAGTGAG-3′ Reversed: 5′-AGTTCCCTTATGACTGGGG-3′ | 174 |
PRSS23, serine protease 23; IL-6, interleukin-6; TNF-α, tumor necrosis factor-α; ID, identification. |
1.6 蛋白免疫印迹法检测PRSS23和激活型Caspase-3表达
1.7 流式细胞检测
1.8 酶联免疫吸附试验
1.9 统计学分析
2 结果
2.1 SSc患者皮肤成纤维细胞中PRSS23的表达
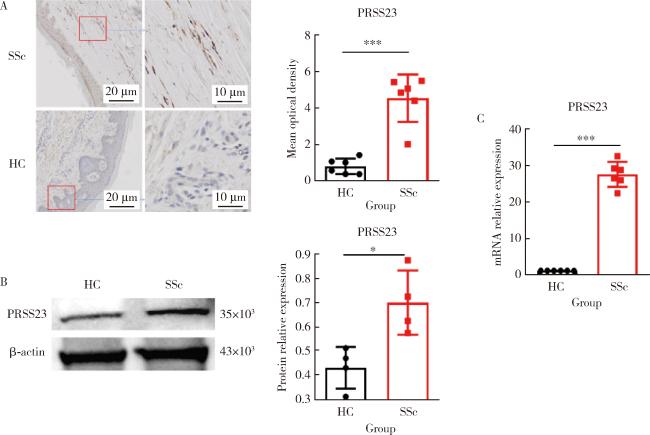
图1 SSc患者皮肤组织成纤维细胞中PRSS23的表达Figure 1 Expression of PRSS23 in fibroblasts from SSc patients' skin tissue A, immunohistochemical staining was performed to compare the expression of PRSS23 in skin tissue slices (the magnification is 20× for the left image and 40× for the right image, and the right image shows an enlarged view of the red box in the left image). Compared with the healthy controls, PRSS23 positive expression in skin tissue slices from SSc patients was significantly increased (n=6, P < 0.001). B, protein immunoblotting was used to quantify the protein expression of PRSS23 in human skin fibroblasts. Compared with the healthy controls, PRSS23 protein expression in skin tissue from SSc patients was significantly increased (n=6, P=0.029). C, RT-qPCR was used to quantify the mRNA expression of PRSS23 in human skin fibroblasts. Compared with the healthy controls, PRSS23 mRNA expression in skin tissue from SSc patients was significantly increased (n=6, P < 0.001), and the statistical method used was the Mann-Whitney U test. * P < 0.05, *** P < 0.001. HC, healthy control; SSc, systemic sclerosis; PRSS23, serine protease 23; RT-qPCR, quantitative real-time PCR. |
表2 PRSS23在SSc患者皮肤组织成纤维细胞中的表达Table 2 Expression of PRSS23 in fibroblasts of skin tissue of SSc patients |
| Items | Sample size (n) | Value, M (P25-P75) |
| Mean optical density | ||
| HC | 6 | 0.806 (0.395-1.173) |
| SSc | 6 | 4.952 (3.806-5.439)*** |
| Protein relative expression | ||
| HC | 4 | 0.451 (0.342-0.502) |
| SSc | 4 | 0.675 (0.587-0.837)* |
| mRNA relative expression | ||
| HC | 6 | 1.000 |
| SSc | 6 | 27.590 (25.020-30.000)*** |
*P<0.05, ***P<0.001, HC vs. SSc. PRSS23, serine protease 23; HC, healthy control; SSc, systemic sclerosis. |
2.2 PRSS23抑制皮肤成纤维细胞凋亡
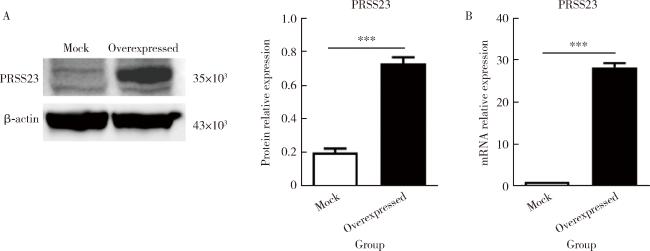
图2 转染PRSS23质粒的皮肤成纤维细胞过表达PRSS23Figure 2 Overexpression of PRSS23 in skin fibroblasts transfected with PRSS23 plasmid A, quantification of PRSS23 protein expression levels in fibroblasts transfected with PRSS23 plasmid or empty vector by Western blot. The PRSS23 protein expression was significantly increased in the overexpression group compared to the empty vector control group (n=4, P < 0.001). B, quantification of PRSS23 mRNA expression levels in two types of cells by RT-qPCR. The mRNA expression of PRSS23 was significantly higher in the overexpression group than in the empty vector control group (n=4, P < 0.001), indicating a successful transfection. The statistical method used was unpaired t test. *** P < 0.001. Mock, empty vector control group; Overexpressed, PRSS23 overexpression group; PRSS23, serine protease 23. |
表3 PRSS23在转染PRSS23质粒的皮肤成纤维细胞中的表达Table 3 Expression of PRSS23 in skin fibroblasts transfected with PRSS23 plasmid |
| Items | Sample size (n) | Value, ${\bar x}$±SE |
| Protein relative expression (PRSS23) | ||
| Mock | 3 | 0.199±0.023 |
| Overexpressed | 3 | 0.730±0.037*** |
| mRNA relative expression | ||
| Mock | 4 | 1.000 |
| Overexpressed | 4 | 28.160±0.507*** |
*** P<0.001, mock vs. overexpressed. Mock, empty vector control group; Overexpressed, PRSS23 overexpression group; PRSS23, serine protease 23; SE, standard error. |
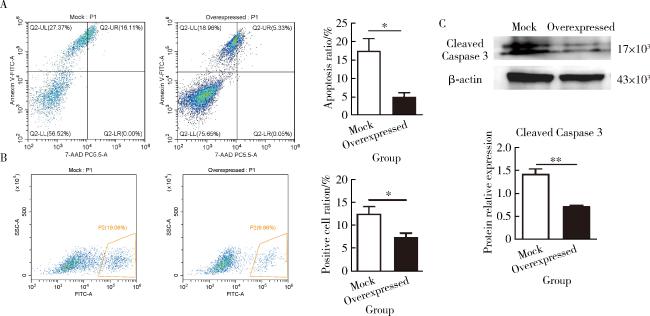
图3 过表达PRSS23抑制皮肤成纤维细胞凋亡Figure 3 Overexpression of PRSS23 inhibits apoptosis of skin fibroblasts A, BJ cells transfected with PRSS23 plasmid or empty vector were treated with 400 μmol/L hydrogen peroxide for 12 h to induce apoptosis. After staining with the Annexin V-FITC/7-AAD apoptosis detection kit, cells were analyzed by flow cytometry. Left panel shows the flow cytometry results, and the right panel shows the statistical analysis of apoptosis rate. Compared to the control group, the overexpression of PRSS23 decreased the apoptosis rate (n=4, P=0.022). B, after hydrogen peroxide treatment, cells were stained with anti-cleaved Caspase-3 antibody and analyzed by flow cytometry. Left panel shows the flow cytometry results, and the right panel shows the statistical analysis of cleaved Caspase-3 positive cells. Compared to the control group, the overexpression of PRSS23 reduced the ratio of cleaved Caspase-3 positive cells (n=4, P=0.026). C, the expression level of cleaved Caspase-3 in the two cell groups was quantified by Western blot. Top panel shows the Western blotting results, and the bottom panel shows the relative expression levels of cleaved Caspase-3 (n=4, P=0.003). The statistical analysis was performed using the unpaired t test. * P < 0.05, ** P < 0.01. Mock, empty vector control group; Overexpressed, PRSS23 overexpression group; PRSS23, serine protease 23; FITC, fluorescein isothiocyanate. |
表4 PRSS23抑制皮肤成纤维细胞凋亡率和相关凋亡蛋白的测定Table 4 Determination of the inhibition of apoptosis rate and related apoptotic proteins by PRSS23 in skin fibroblasts |
| Items | Sample size (n) | Value, ${\bar x}$±SE |
| Apoptosis ratio | ||
| Mock | 3 | (17.480±3.212)% |
| Overexpressed | 3 | (5.043±1.097)%* |
| Positive cell ratio | ||
| Mock | 4 | (12.510±1.472)% |
| Overexpressed | 4 | (7.460±0.866)%* |
| Protein relative expression (cleaved Caspase 3) | ||
| Mock | 4 | 1.422±0.105 |
| Overexpressed | 4 | 0.718±0.022** |
* P<0.05, ** P<0.01, mock vs. overexpressed. Mock, empty vector control group; Overexpressed, PRSS23 overexpression group; PRSS23, serine protease 23; SE, standard error. |
2.3 PRSS23促进皮肤成纤维细胞分泌炎症因子
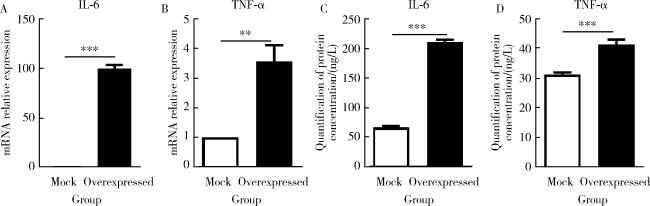
图4 过表达PRSS23促进皮肤成纤维细胞分泌促炎因子IL-6和TNF-αFigure 4 Overexpression of PRSS23 promotes the secretion of pro-inflammatory cytokines IL-6 and TNF-α in skin fibroblasts A, quantification of IL-6 mRNA expression in cells using RT-qPCR. Compared to the control group with empty vector, the PRSS23 overexpression group showed a significant increase in IL-6 mRNA expression (n=4, P < 0.001). B, quantification of TNF-α mRNA expression in cells using RT-qPCR. Compared to the control group with empty vector, the PRSS23 overexpression group showed a significant increase in TNF-α mRNA expression (n=4, P=0.004). C, quantification of IL-6 protein concentration in cell supernatants using ELISA. Compared to the control group with empty vector, the PRSS23 overexpression group showed a significant increase in IL-6 protein concentration (n=4, P < 0.001). D, quantification of TNF-α protein concentration in cell supernatants using ELISA. Compared to the control group with empty vector, the PRSS23 overexpression group showed a significant increase in TNF-α protein concentration (n=4, P < 0.001). Statistical analysis was performed using unpaired t test. ** P < 0.01, *** P < 0.001. Mock, empty vector control group; Overexpressed, PRSS23 overexpression group; PRSS23, serine protease 23; IL-6, interleukin-6; TNF-α, tumor necrosis factor-alpha; RT-qPCR, quantitative real-time PCR; ELISA, enzyme linked immunosorbent assay. |
表5 PRSS23对皮肤成纤维细胞炎症因子分泌的影响Table 5 Effect of PRSS23 on the secretion of inflammatory cytokines in skin fibroblasts |
| Items | Sample size (n) | Value, ${\bar x}$±SE |
| IL-6 mRNA relative expression | ||
| Mock | 3 | 1.000 |
| Overexpressed | 3 | 99.780±1.796*** |
| TNF-α mRNA relative expression | ||
| Mock | 4 | 1.000 |
| Overexpressed | 4 | 3.555±0.555** |
| IL-6 protein content (cell supernatant)/(ng/L) | ||
| Mock | 4 | 65.930±1.768 |
| Overexpressed | 4 | 211.600±2.431*** |
| TNF-α protein content (cell supernatant)/(ng/L) | ||
| Mock | 4 | 31.150±0.360 |
| Overexpressed | 4 | 41.190±0.949*** |
** P<0.01, *** P<0.001, mock vs. overexpressed. Mock, empty vector control group; Overexpressed, PRSS23 overexpression group; PRSS23, serine protease 23; SE, standard error; IL-6, interleukin 6; TNF-α, tumor necrosis factor alpha. |
