1 资料与方法
1.1 研究对象的选择及分组
1.2 临床资料收集
1.3 肌肉量测量
1.4 RA患者血清蛋白质组学非标记液相色谱-串联质谱分析
1.5 血清间-α-胰蛋白酶抑制蛋白重链3(inter-alpha-trypsin inhibitor heavy chain H3, ITIH3)检测
1.6 生物信息学和统计学分析
2 结果
2.1 RA患者肌肉量减少相关的血清蛋白组学特征及生物信息学分析
表1 19例进行血清LC-MS/MS检测的RA患者的基线临床特征比较Table 1 Comparisons of baseline characteristics of RA patients in serum LC-MS/MS analysis |
| Items | Non-myopenia RA patients (n=9) | Myopenia RA patients (n=10) | Statistics | P |
| Female, n (%) | 7(77.8) | 8(80.0) | χ2=0.000 | >0.999 |
| Age/years, $\bar x \pm s$ | 45.1±9.5 | 40.0±10.0 | t=1.139 | 0.271 |
| ASMI/(kg/m2), $\bar x \pm s$ | 6.50±0.55 | 5.17±0.62 | t=4.932 | <0.001 |
| Disease duration/month, M (Q1, Q3) | 8.0(5.5, 10.0) | 10.0(1.0, 12.5) | Z=-0.369 | 0.712 |
| Active smoking, n (%) | 0(0.0) | 1(10.0) | - | >0.999* |
| CDAI, M (Q1, Q3) | 19.0(14.5, 29.0) | 22.5(11.8, 27.0) | Z=-0.286 | 0.775 |
RA, rheumatoid arthritis; ASMI, appendicular skeletal muscle mass index; CDAI, clinical disease activity index. *showing 2-sided significancy of Fisher’ s exact test. |
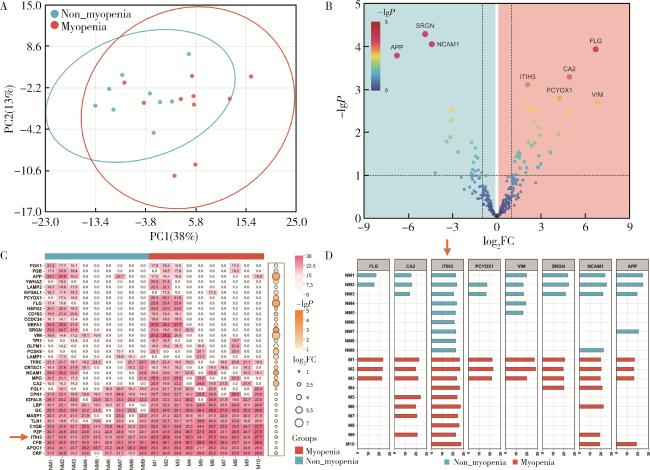
图1 肌肉量减少组和肌肉量正常组RA患者血清LC-MS/MS检测及生物信息学分析Figure 1 Serum LC-MS/MS and bioinformatics analysis of myopenia and non-mypoenia RA patients Serum protein profile analysis showing principal component analysis plot (A), DEPs volcano plot (B), DEPs heatmap (C), DEPs sample distribution plot (D) of myopenia and non-mypoenia RA patients. DEPs, differentially expressed proteins; PC, principal component; FC, fold change. |
2.2 ELISA法检测RA患者基线血清ITIH3水平
表2 健康对照组与RA患者组的基线临床特征比较Table 2 Comparisons of baseline characteristics between RA patients and healthy controls |
| Items | HC(n=51) | Non-myopenia RA patients (n=51) | Myopenia RA patients (n=51) | All RA patients(n=102) | Statistics | P |
| Female, n (%) | 44 (86.3) | 39(76.5) | 42(82.4) | 81 (79.4) | χ2 =2.753a | 0.252 |
| Age/years, $\bar x \pm s$ | 46.9±8.8 | 48.7±9.8 | 49.5±13.0 | 49.1±11.5 | F=0.811a | 0.446 |
| ASMI/(kg/m2), $\bar x \pm s$ | 6.31±0.73 | 6.81±0.67 | 5.23±0.63 | 6.0±1.0 | F=72.335a | < 0.001 |
| Myopenia, n (%) | 10 (19.6) | 0(0.0) | 51(100.0) | 51 (50.0) | - | < 0.001b* |
| Disease duration/month, M(Q1, Q3) | - | 39 (6, 111) | 65 (14, 133) | 41 (10, 120) | Z=-2.202c | 0.028 |
| Active smoking, n (%) | - | 7(13.7) | 6(11.8) | 13 (14.6) | χ2=0.088c | 0.767 |
| Positive RF, n (%) | - | 38(74.5) | 42(82.4) | 80 (78.4) | χ2=0.927c | 0.336 |
| Positive ACPA, n (%) | - | 37(72.5) | 41(80.4) | 78 (76.5) | χ2=0.872c | 0.350 |
| 28TJC, M (Q1, Q3) | - | 3 (1, 8) | 4 (1, 7) | 3 (1, 7) | Z=-0.199c | 0.842 |
| 28SJC, M (Q1, Q3) | - | 2 (1, 6) | 2 (0, 5) | 2 (1, 5) | Z=-0.149c | 0.882 |
| PtGA/cm, M (Q1, Q3) | - | 4 (2, 7) | 4 (3, 6) | 4 (2, 6) | Z=-0.236c | 0.814 |
| PrGA/cm, M (Q1, Q3) | - | 3 (2, 7) | 4 (3, 6) | 4 (2, 6) | Z=-0.508c | 0.611 |
| Pain VAS/cm, M (Q1, Q3) | - | 3 (2, 7) | 4 (2, 5) | 4 (2, 5) | Z=-0.784c | 0.433 |
| ESR/(mm/h), M (Q1, Q3) | - | 32 (19, 50) | 49 (24, 77) | 37 (21, 64) | Z=-2.534c | 0.011 |
| CRP/(mg/L), M (Q1, Q3) | - | 5.9 (3.3, 10.6) | 10.2 (3.3, 25.5) | 6.8 (3.3, 17.9) | Z=-1.581c | 0.114 |
| CDAI, M (Q1, Q3) | - | 13 (6, 28) | 16 (9, 23) | 14 (8, 24) | Z=-0.378c | 0.705 |
| Active disease, n (%) | 44 (86.3) | 43(84.3) | 87 (85.3) | χ2=0.078c | 0.780 | |
| HAQ-DI, M (Q1, Q3) | - | 0.25 (0.00, 1.00) | 0.50 (0.13, 1.25) | 0.38 (0.00, 1.06) | Z=-0.892c | 0.372 |
| Physical dysfunction, n (%) | 14 (27.5) | 15(29.4) | 29(28.4) | χ2=0.048c | 0.826 | |
| mTSS, M (Q1, Q3) | - | 5 (0, 32) | 11 (3, 46) | 8 (0, 36) | Z=-1.564c | 0.118 |
| Radiological joint destruction, n (%) | 19 (37.3) | 27 (52.9) | 46 (45.1) | χ2=2.534c | 0.111 |
HC, healthy controls; RA, rheumatoid arthritis; ASMI, appendicular skeletal muscle mass index; RF, rheumatoid factor; ACPA, anti-cyclic citrullinated protein antibodies; 28TJC, 28 tender joint counts; 28SJC, 28 swollen joint counts; PtGA, patient global assessment of disease activity; PrGA, physician global assessment of disease activity; VAS, visual analogue scale; ESR, erythrocyte sedimentation rate; CRP, C-reactive protein; CDAI, clinical disease activity index; HAQ-DI, health assessment questionnaire-disability index; mTSS, modified total Sharp score. a, comparison among HC, non-myopenia RA patients and myopenia RA patients; b, comparison of HC to all RA patients; c, comparison of non-myopenia RA patients to myopenia RA patients. * showing 2-sided significancy of Fisher’ s exact test between HC and all RA patients. |
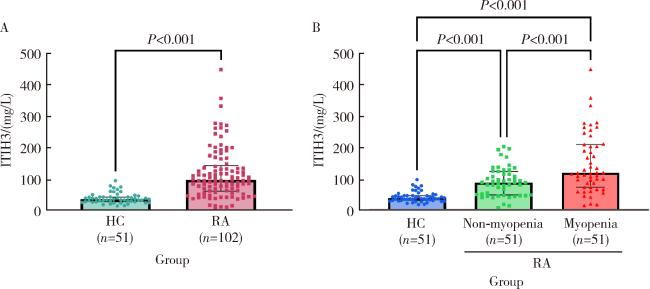
图2 健康对照组与RA患者组基线血清ITIH3水平的比较Figure 2 Comparisons of baseline serum ITIH3 levels of RA patients and healthy controls A, the serum ITIH3 levels of RA patients and healthy controls were detected by ELISA; B, comparison of serum ITIH3 levels among myopenia/non-mypoenia RA patients and healthy controls. RA, rheumatoid arthritis; HC, healthy controls; ELISA, enzyme- linked immunosorbent assay; ITIH3, inter- alpha-trypsin inhibitor heavy chain 3. |
2.3 基线血清ITIH3水平升高是RA患者基线肌肉量减少的独立危险因素
表3 Logistic回归分析RA患者基线肌肉量减少的相关因素Table 3 Logistic regression analysis of factors related to baseline myopenia in RA patients |
| Items | Univariate | Multivariate1 | Multivariate2 | |||||
| OR(95%CI) | P | OR(95%CI) | P | OR(95%CI) | P | |||
| ITIH3 | 1.012 (1.005-1.019) | < 0.001 | 1.018 (1.009-1.029) | < 0.001 | 1.024 (1.013-1.038) | < 0.001 | ||
| Female | 1.436 (0.548-3.875) | 0.462 | 1.137 (0.215-6.436) | 0.880 | ||||
| Age | 1.006 (0.972-1.042) | 0.721 | 1.002 (0.949-1.059) | 0.939 | ||||
| Disease duration | 1.004 (0.999-1.009) | 0.112 | 1.000 (0.993-1.007) | 0.977 | 1.000 (0.993-1.008) | 0.960 | ||
| Active smoking | 0.813 (0.241-2.667) | 0.731 | ||||||
| Positive RF | 1.596 (0.619-4.271) | 0.335 | ||||||
| Positive ACPA | 1.551 (0.619-4.003) | 0.350 | ||||||
| 28TJC | 0.990 (0.918-1.065) | 0.779 | ||||||
| 28SJC | 0.961 (0.865-1.063) | 0.442 | ||||||
| PtGA | 1.002 (0.874-1.150) | 0.972 | ||||||
| PrGA | 1.010 (0.877-1.165) | 0.886 | ||||||
| Pain VAS | 1.036 (0.885-1.215) | 0.660 | ||||||
| ESR | 1.016 (1.003-1.031) | 0.013 | 1.021 (1.000-1.045) | 0.056 | 1.024 (0.999-1.052) | 0.065 | ||
| CRP | 1.009 (0.995-1.026) | 0.213 | 0.986 (0.959-1.015) | 0.321 | 0.986 (0.954-1.022) | 0.403 | ||
| CDAI | 0.995 (0.966-1.026) | 0.761 | ||||||
| HAQ-DI | 1.039 (0.617-1.758) | 0.884 | ||||||
| Physical dysfunction | 1.112 (0.449-2.771) | 0.818 | ||||||
| mTSS | 1.005 (0.996-1.016) | 0.289 | ||||||
| Radiological joint destruction | 1.945 (0.851-4.531) | 0.115 | 1.435 (0.4595-4.463) | 0.530 | 1.833 (0.521-6.576) | 0.344 | ||
| Previous treatment | ||||||||
| Treatment naÏve | 0.804 (0.316-2.013) | 0.641 | 0.805 (0.052-16.06) | 0.881 | ||||
| Glucocorticoids | 1.314 (0.569-3.060) | 0.522 | 3.126 (0.874-13.37) | 0.097 | ||||
| csDMARDs | 1.458 (0.545-4.013) | 0.453 | 0.436 (0.040-5.478) | 0.494 | ||||
| bDAMRDs/tsDMARDs | 1.537 (0.243-12.12) | 0.644 | 1.022 (0.099-10.94) | 0.985 | ||||
ITIH3, inter-alpha trypsin inhibitor heavy chain 3; RA, rheumatoid arthritis; RF, rheumatoid factor; ACPA, anti-cyclic citrullinated protein antibodies; 28TJC, 28 tender joint counts; 28SJC, 28 swollen joint counts; PtGA, patient global assessment of disease activity; PrGA, physician global assessment of disease activity; VAS, visual analogue scale; ESR, erythrocyte sedimentation rate; CRP, C-reactive protein; CDAI, clinical disease activity index; HAQ-DI, health assessment questionnaire-disability index, mTSS, modified total Sharp score; csDMARDs, conventional synthetic disease-modifying antirheumatic drugs; bDAMRDs, biological disease-modifying antirheumatic drugs; tsDMARDs, target synthetic disease-modifying antirheumatic drugs. Multivariate1, including ITIH3, disease duration, ESR, CRP and radiological joint destruction. Multivariate2, including ITIH3, gender, age, disease duration, ESR, CRP, radiological joint destruction and previous treatment. |