儿童健康关系国家未来与家庭幸福,是经济社会可持续发展的重要基础。近年来,国家相继出台多项纲领性文件,明确提出要优化儿童医疗资源布局,提升服务能力,实现公平可及,推动儿童健康事业高质量发展。北京市儿科医疗资源总量持续增长,服务体系不断完善,但优质资源仍高度集中,部分专科医院长期处于超负荷运行状态,地区间配置不均问题日益凸显。
1 资料与方法
1.1 研究地区
本研究地区为北京市,北京市总面积约1.64万平方千米,现辖16个行政区。《北京市城市总体规划(2016年—2035年)》将全市各行政区划分为中心城区(东城、西城、朝阳、海淀、丰台、石景山)、城市副中心(通州)、平原新城(顺义、大兴、昌平、房山新城)及生态涵养区(门头沟、平谷、怀柔、密云、延庆,以及昌平、房山山区)四类功能区。
根据2020年第七次全国人口普查数据,北京市常住人口为2 189.3万人,其中儿童为259.2万人,占总人口的11.8%。作为首都,北京市医疗资源承担着保障本地及周边地区儿童健康服务的重要任务[11]。
1.2 数据来源
鉴于北京市仅在人口普查年份公布详尽的儿童人口数据,因此,本研究采用2020年北京市第七次人口普查获取的社区常住儿童人口数据作为基准,并结合《北京区域统计年鉴》中的历年人口出生率与自然增长率进行趋势外推,预测2025年及2030年基于社区的儿童人口数据。
儿科医疗资源相关数据,包括儿童专科医院及设有儿科的医疗机构名称、地址、儿科实有床位数和儿科执业(助理)医师数,以及机构的外地患者占比均来源于医疗机构卫生统计报表。社区与医疗机构的空间坐标通过百度地图API(application programming interface)获取,并统一转换为WGS-84坐标系。
1.3 研究方法
1.3.1 改进的两步移动搜寻法
两步移动搜寻法(two-step floating catchment area method, 2SFCA)广泛应用于评估医疗服务、公共服务的空间可及性[12]。改进的两步移动搜寻法在原有方法的基础上引入距离衰减函数,以表征医疗机构和居民点之间的空间阻抗,更真实地反映距离对医疗服务可获得性的影响[13]。本研究采用幂函数作为距离衰减函数。该函数能够有效刻画医疗服务利用随距离增加而逐渐减弱的规律,在中远距离范围内仍保留一定权重,其衰减速度在较远距离阶段相对平缓[14],更符合现实中患者跨区域就医的行为特征,有助于更为精准地识别医疗服务缺乏区[15],已广泛应用于医疗服务可及性研究。空间可及性计算公式(1)为
参数含义详见表 1,其中,时间阈值(d0)与出行摩擦系数β的设定参考既有研究中常用设置,并结合研究区域实际情况进行调整。已有研究表明,城市医疗服务可及性分析中时间阈值通常设定在60 min[16],而高等级医院或住院服务的可及性测算通常采用更高的时间阈值,即120 min[17],考虑到患儿家庭对住院服务的可接受出行时间相对较长,因此将床位可及性的时间阈值设定为120 min;而门诊服务更强调及时性,故将其时间阈值设定为60 min。出行摩擦系数β多取1~2,1.5和2应用较为广泛[18-21],值越大反映距离对服务利用的抑制作用越强。本研究参考已有研究选取β=1.5[19, 21],可较好地反映距离对城市医疗服务利用的影响。
表1 空间可及性公式参数含义Table 1 Description of parameters used in the spatial accessibility model |
| Parameters | Definition | Indicator |
| Ai | Spatial accessibility of residential location i | Number of beds per 1 000 children; Number of physicians per 1 000 children |
| Sj | Service capacity of healthcare institution j | Pediatric resources of each healthcare institution |
| Dk | Number of population at residential location k | Child population at location k |
| dij | Impedance between residential location i and healthcare institution j | Travel time by driving |
| d0 | Travel time threshold | 120 minutes for bed accessibility; 60 minutes for physician accessibility |
| n | Number of destination points | Number of healthcare institutions |
| m | Number of origin points | Number of population locations |
| β | Distance decay coefficient | 1.5 |
1.3.2 可及性差异最小化的优化模型
Ai是根据两步移动搜寻法计算得到的可及性得分;a是可及性的加权平均值;S是总供给规模;Di为需求点i的需求规模;D是总需求规模。模型本质上是一个非线性的二次规划问题,相较于传统的线性设施选址模型,具有更高的复杂性。为求解该优化问题,本文采用粒子群优化算法(particle swarm optimization, PSO)。经过预实验测试,除将最大迭代次数提升至10 000次外,其余参数均采用工具箱的默认设定,以增强全局搜索能力,每次迭代都重新计算各需求点可及性,最终,优化结果输出为各社区的最优儿科床位供给数量。为进一步量化优化后空间可及性的公平性改善水平,本研究引入基尼系数(Gini coefficient)对优化前后可及性的公平性进行评价。
2 结果
2.1 2022年儿科资源基本情况
截至2022年,北京全市常住儿童约264万,拥有儿童专科医院11家, 设儿科病房的医院175家。全市共配置儿科床位4 704张,儿科执业(助理)医师4 011名,每千名儿童床位数1.78张,每千名儿童儿科执业(助理)医师1.52名。
2.2 儿科资源空间可及性
2.2.1 儿科执业(助理)医师
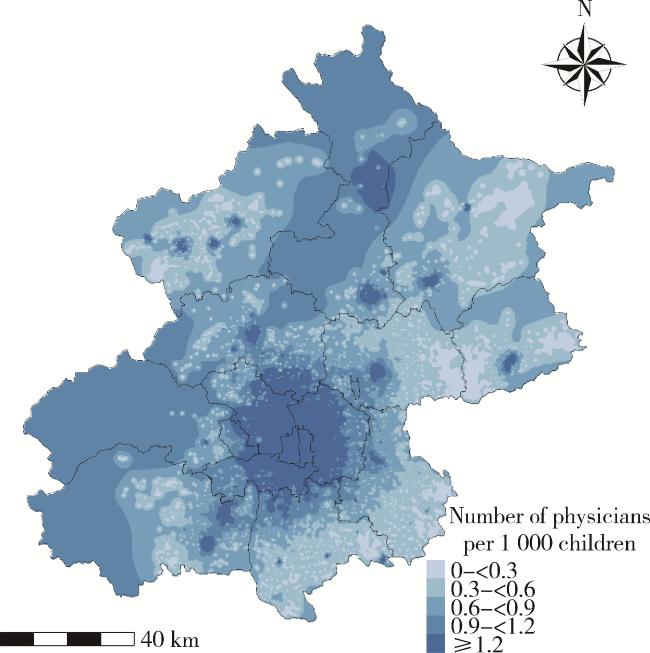
北京市儿科执业(助理)医师服务空间可及性[每千名常住儿童儿科执业(助理)医师数]如图 1所示,空间可及性平均值为0.97。有3 253个社区(45.28%)的空间可及性低于0.3,1 882个社区(26.20%)执业(助理)医师可及性在1.2以上,整体呈现出中心高、外围低的现象,中心城区可及性较高,而密云区、通州区和大兴区空间可及性相对较差。
2.2.2 儿科床位
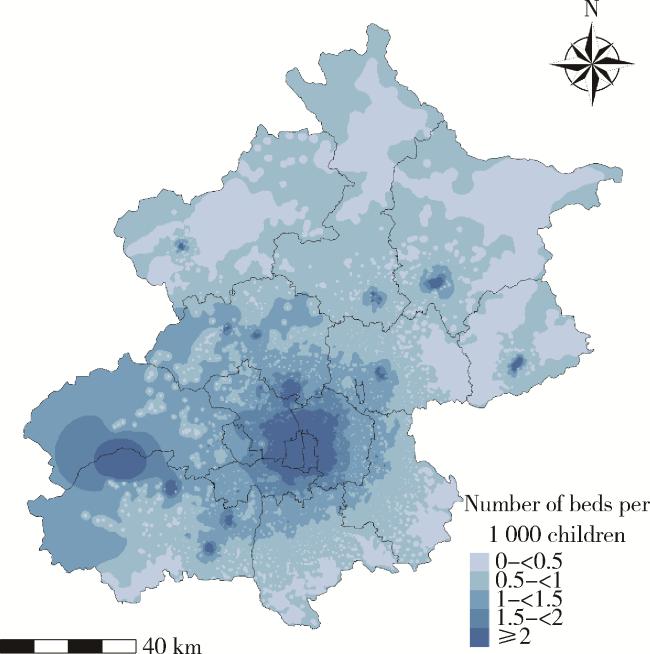
北京市儿科床位空间可及性(每千名常住儿童儿科床位数)如图 2所示,空间可及性平均值为1.17,标准差为2.78,基尼系数为0.518。3 244个社区(45.16%)儿科床位服务可及性在0.5以下,1 194个社区(16.62%)儿科床位可及性在2.0以上,主要位于海淀区、朝阳区和西城区。整体分布也呈现中心高、外围低的特征,与儿科医师可及性分布趋势基本一致。怀柔区、延庆区和密云区等生态涵养区的空间可及性相对较差。
2.3 儿科资源空间布局优化
2.3.1 儿科执业(助理)医师
根据2024年国家卫生健康委员会发布的《关于推进儿童医疗卫生服务高质量发展的意见》,到2025年每千名儿童拥有儿科执业(助理)医师数达到0.87人、每千名儿童床位数达到2.50张;《中国儿童发展纲要(2021—2030)》提出,到2030年每千名儿童拥有儿科执业(助理)医师达到1.12人。北京市2022年每千名儿童拥有儿科执业(助理)医师数已达1.52人,剔除首都儿科研究所附属儿童医院和首都医科大学附属北京儿童医院承担京外患者门急诊服务量占比所对应的医师数后,仍达1.29人,已超过2025年和2030年国家目标。对标国家政策目标,北京市儿科医师资源总体规模已满足阶段性发展要求。因此,在新增资源总量固定的条件下,本研究未对医师数量进行新增规模测算,将优化聚焦于儿科床位资源的增量。
2.3.2 儿科床位空间布局优化
根据国家政策目标提出的2025年(每千名儿童2.5张床位)和2030年(每千名儿童3.17张床位)的目标要求,结合北京市未来儿童人口预测结果,测算得到2025年和2030年所需新增儿科床位总量。至2025年,全市需新增儿科床位1 735张;至2030年,需新增儿科床位1 422张。在新增床位总量固定的条件下,构建基于可及性差异最小化的优化模型,对新增床位在各医疗机构间的空间分配进行优化调整,以改善可及性。同时,构建基于行政区人口及政策目标值测算的分配方案,该方案反映当前规划实践中较为常见的资源配置逻辑,可作为现实配置参考。通过对两种方案结果的对比分析,检验优化模型与现行规划思路之间的一致性与可行性。由于首都儿科研究所附属儿童医院和首都医科大学附属北京儿童医院床位规模较大,且承担全市乃至全国重症患儿救治任务,其服务范围明显超出所在行政区,因此不宜按地理位置直接划分资源归属。依据2022年住院服务量中京内外患者占比,对外地患者对应的床位服务量进行折算扣除后,再根据京内各行政区住院服务量占比将床位分配至各区。可及性差异最小化的优化模型结果详见表 2。在总新增床位相同的条件下,优化模型指引新增床位优先投向大兴区、门头沟区和通州区。基于人口规模与政策目标值的分配方案中,新增床位排名前三的行政区为大兴区、海淀区和通州区,两种方案在大兴区与通州区上保持一致。进一步比较各行政区新增儿科床位规模可见,优化结果在门头沟区、怀柔区、密云区、延庆区等生态涵养区的新增床位数量高于基于人口的分配方案,而在部分中心城区的新增规模相对较低。
表2 两种方法预测2025年和2030年应新增床位数比较Table 2 Comparison of additional pediatric beds required in 2025 and 2030 predicted by two methods |
| District | A | B | B-A | ABP | |||||
| 2025 | 2030 | 2025 | 2030 | 2025 | 2030 | ||||
| Changping | 568 | 651 | 723 | 83 | 155 | 9 | 2 | ||
| Chaoyang | 852 | 984 | 927 | 132 | 75 | 153 | 94 | ||
| Daxing | 225 | 631 | 676 | 406 | 451 | 245 | 207 | ||
| Dongcheng | 245 | 219 | 158 | / | / | 57 | 45 | ||
| Fangshan | 321 | 436 | 434 | 115 | 113 | 41 | 37 | ||
| Fengtai | 219 | 539 | 477 | 320 | 258 | 29 | 20 | ||
| Haidian | 470 | 847 | 690 | 377 | 220 | 44 | 30 | ||
| Huairou | 105 | 122 | 104 | 17 | / | 138 | 124 | ||
| Mentougou | 68 | 112 | 103 | 44 | 35 | 203 | 237 | ||
| Miyun | 92 | 160 | 159 | 68 | 67 | 198 | 139 | ||
| Pinggu | 78 | 153 | 150 | 75 | 72 | 172 | 112 | ||
| Shijingshan | 85 | 163 | 171 | 78 | 86 | 54 | 50 | ||
| Shunyi | 281 | 400 | 379 | 119 | 98 | 6 | 2 | ||
| Tongzhou | 214 | 572 | 620 | 358 | 406 | 203 | 186 | ||
| Xicheng | 830 | 352 | 256 | / | / | 46 | 30 | ||
| Yanqing | 51 | 98 | 99 | 47 | 48 | 137 | 107 | ||
| Total | 4 704 | 6 439 | 6 126 | 1 735 | 1 422 | 1 735 | 1 422 | ||
“/” indicates that no additional beds are required. A, beds per district after allocating specialty hospital beds; B, total beds based on policy target; B-A, additional beds required based on policy target; ABP, additional beds predicted by the optimization model. |
2.4 模型优化后儿科床位可及性
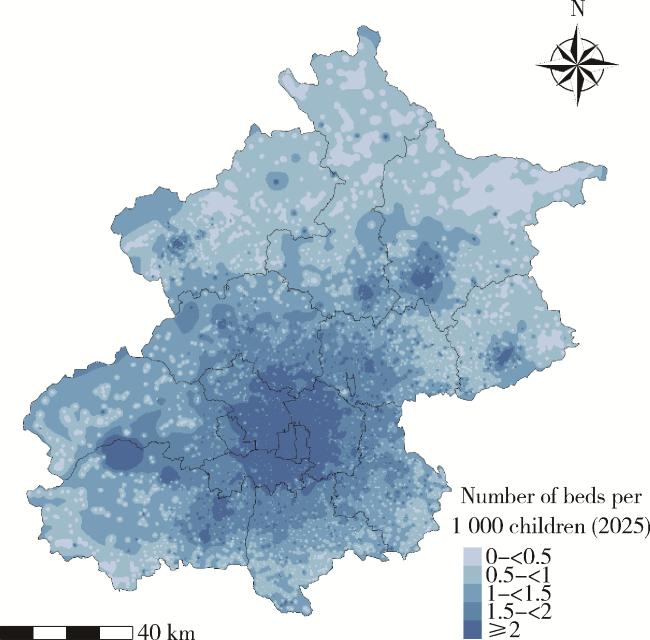
按照2025年目标优化后(图 3),北京市儿科床位空间可及性平均值为1.68,标准差2.45,基尼系数为0.416。优化后,全市儿科床位空间可及性平均值显著提升,标准差下降,基尼系数下降。此时有2 468个社区(34.35%)儿科床位空间可及性在0.5以下,2 953个社区(41.11%)儿科床位空间可及性在2.0以上,有1 710个社区(23.80%)儿科床位空间可及性改善超过1.0,与现状相比, 朝阳区、丰台区、通州区、昌平区、大兴区的可及性明显改善。
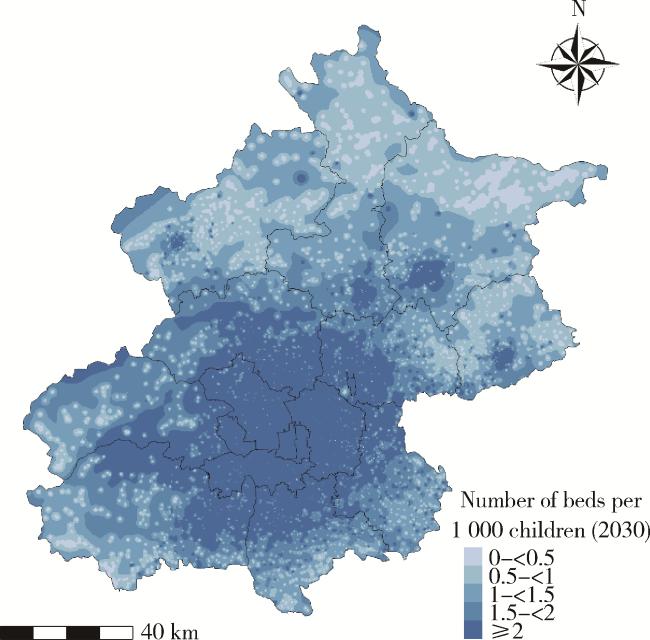
按照2030年目标优化后(图 4),北京市儿科床位可及性平均值为2.31,标准差2.56,基尼系数为0.421。与现状相比,优化后全市儿科床位空间可及性平均值显著提升,标准差下降,基尼系数下降。此时2 193个社区(30.53%)儿科住院服务可及性在0.5以下,有1 601个社区(22.29%)儿科床位可及性改善超过2.0,中心城区和平原新城的可及性都有明显改善。优化后可及性的基尼系数下降,表明空间分布不均衡程度有所降低。
3 讨论
3.1 北京市儿科资源分布不均和可及性差异明显
与千人口资源拥有量相比,可及性指标在综合考虑距离衰减和服务范围后,更能反映居民实际获得医疗服务的水平。尽管北京市千人口儿科医师资源拥有量已达到国家政策目标,但不同区域之间可及性仍存在显著差异,表明资源总量达标并未完全转化为空间公平。高水平医疗机构及其人才资源往往集中于中心城区,而外围地区在吸引和留住人才方面相对处于劣势。同时,患者倾向于跨区域至高水平医院就诊,也在一定程度上削弱了外围地区医疗资源的服务能力与吸引力。而医师资源的跨区域流动性相对有限,这也在一定程度上制约了空间可及性的改善,可以通过医联体、多点执业等政策引导儿科医师流动与下沉,而非单纯依赖资源增量来优化空间可及性。
3.2 人口规模导向与可及性导向优化方案的比较
基于可及性差异最小化模型的优化结果与基于人口分配床位的方案,在总体新增规模和重点增设床位的行政区上呈现出较高一致性。两种方案均将大兴区和通州区等人口规模较大、需求增长较快的行政区识别为新增床位较多的区域。这两个行政区既是首都功能疏解、人口导入的核心承载区,也是连接京津冀医疗协同发展的战略要地,对其优先投入新增资源,有助于提升全市儿科资源可及性。这一优化方向与首都儿科研究所附属儿童医院、首都医科大学附属北京儿童医院新院区布局方向一致,可以有效填补北京市东部、南部优质儿科资源缺口。
然而,在生态涵养区的儿科床位分配上,两种方案存在较大差异。优化模型将部分新增资源向生态涵养区等现状可及性相对不足的行政区倾斜,对于初始可及性水平较低的地区,新增一定规模的床位资源能够带来更为显著的可及性提升,从而对整体空间差异的缩小贡献更大。因此,模型在资源分配过程中倾向于优先补偿服务短缺最为突出的区域。而按人口分配方案则更侧重人口规模较大的中心城区。该差异反映出两种配置逻辑的侧重点不同,前者综合考虑供给水平、需求规模与空间距离阻抗,对现状可及性不足的行政区进行结构性调整;后者则重点考量儿童人口规模,更强调规模匹配。
当前以人口规模为基础的资源配置方式在总体方向上具有较强的可行性,其操作简便,直接对接政策指标,受到政府部门广泛使用[26]。优化模型通过识别可及性不足的行政区并进行针对性投入,为缓解地区间可及性差异提供了量化工具。在资源总量既定的约束条件下,基于可及性的优化路径则能够在不突破总量约束的前提下优化供需结构,实现效率提升与公平改善的协同推进[27-28]。然而,以可及性为导向的优化方法也存在局限性,由于模型以空间可及性指标为优化目标,可能导致部分人口密度较低地区获得较高规模的资源增量分配。该结果反映的是既定目标下的数学最优解,但由于未考虑可操作性不一定对应现实条件下的最优配置。因此,可及性导向的优化结果可作为传统配置方案的补充,为儿科医疗资源的精细化布局优化提供量化依据。
3.3 可及性导向的北京市儿科医疗资源优化建议
一是将可及性指标纳入儿科资源配置决策框架。基于可及性差异最小化模型在识别空间失衡与改善可及性上的优势,以及不同地区间可及性差异显著的现状,建议在儿科资源配置过程中将可及性作为重要评估指标之一,与千人口资源拥有量形成互补。同时,探索建立动态监测机制,定期评估床位使用率,结合儿童人口变化趋势,对资源配置现状进行评估与调整,以增强资源布局决策的科学性与适应性。
二是实施行政区差异化发展策略。大兴区、通州区为两种方案共同识别的儿科床位重点增量区域,应按既有规划推进首都儿科研究所附属儿童医院和首都医科大学附属北京儿童医院新院区建设,打造区域儿科服务中心,实现资源增量与空间公平提升的目标。对于生态涵养区等可及性相对不足地区,应重点强化综合医院儿科服务能力建设。中心城区儿科资源已相对集中,建议不再大规模扩张床位,应转向资源提质增效与存量优化,提高床位使用效率。
三是优化儿科医师空间布局,推动资源下沉。在医师总量已达到标准,但空间可及性存在差异的背景下,应充分发挥北京市紧密型儿科医联体的协同作用,通过优质医疗资源下沉和医师流动机制,推动医联体牵头医院与通州区、大兴区、密云区等可及性较差行政区成员单位建立常态化协作机制。同时,依托多点执业政策,促进儿科医师跨机构流动,提高生态涵养区的服务可及性。可探索基于绩效考核与财政激励的引导机制,鼓励优质医疗资源向可及性不足地区倾斜。在总量不变的前提下,通过提升流动性与完善服务网络,实现医师资源空间配置的结构性优化。
四是完善人才培养与床位配置联动机制,强化儿科服务体系系统支撑。在推进床位结构优化的同时,应同步加强儿科人才培养与引进,坚持投资于物与投资于人并重,真正提升儿童就医公平性与可及性。
3.4 研究的局限性
本研究存在一定局限性,首先,数据上未能纳入2022—2025年儿科资源变化情况;其次,模型基于静态供需假设,未考虑患者实际就医行为、分级转诊体系等动态因素与复杂现实约束。未来研究可围绕以下三方面深入:一是构建融合公平、效率与质量的多目标协同优化模型;二是引入就医行为模拟、分级诊疗政策干预与时空动态数据,增强模型现实解释力;三是将设施布局与人才培养、政策激励等系统要素耦合分析,持续为公共服务资源的精准规划与公平发展提供更为科学的决策支持。