CKD 3期患者由于肾功能储备已显著下降,对缺血等损伤的耐受性更差,这部分患者行肾部分切除术时,如何在保证肿瘤完整切除的前提下尽可能保护肾功能,一直是临床关注的焦点。既往研究探讨了肾部分切除术后AKI的危险因素,包括男性、高血压、糖尿病、肿瘤复杂程度(R.E.N.A.L.评分)、术前估算肾小球滤过率(estimated glomerular filtration rate,eGFR)水平以及肾动脉阻断时间等[2, 7-8]。然而,针对CKD 3期这一特定高危人群的研究尚不充分,该类患者基线肾功能已处于临界水平,术后若发生AKI,不仅可能导致需要短期肾脏替代治疗,更可能加速残余肾功能丧失,使其进入终末期肾病。因此,识别CKD 3期患者行肾部分切除术后发生AKI的危险因素,对于术前风险分层、手术策略优化以及围术期管理具有重要临床意义。基于上述背景,本研究回顾性分析了CKD 3期患者行肾部分切除术后AKI的发生情况,探讨其危险因素,以期为临床决策提供循证依据。
1 资料与方法
1.1 研究对象
回顾性分析北京大学第三医院2013年1月至2025年12月期间行肾部分切除手术患者的临床数据。依据改善全球肾脏病预后组织(Kidney Disease: Improving Global Outcomes, KDIGO)制定的标准,将满足eGFR≥30 mL/(min·1.73 m2)且 < 60 mL/(min·1.73 m2)的患者定义为CKD 3期,将其中eGFR为30~44 mL/(min·1.73 m2)的患者划分为CKD 3b期,eGFR为45~60 mL/(min·1.73 m2) 的患者划分为CKD 3a期[9]。纳入标准为所有行肾部分切除手术且术前为CKD 3期的患者,排除孤立肾、多发肿瘤及围术期肌酐数据缺失的患者。
1.2 数据收集
查阅北京大学第三医院电子病历系统,收集患者围术期的临床资料,包括年龄、性别、术前是否有临床症状、体重指数(body mass index, BMI)、既往合并症情况(高血压、糖尿病、心脑血管疾病)、术前美国麻醉医师协会(American Society of Anesthesio-logists,ASA)评分、术前血肌酐水平、术后1周血肌酐水平、术后是否发生并发症等;收集患者的肿瘤资料,包括肿瘤侧别、肿瘤最大直径、术后病理类型等;收集患者的手术资料,包括手术入路、手术时间、肾动脉阻断时间、术中出血量等。手术入路分为腹腔镜手术和机器人手术,具体的腹腔镜和机器人手术步骤可参照本单位既往的研究报道[10-11]。依据R.E.N.A.L.评分对肿瘤复杂程度进行定义,评分4~6分定义为低危组,评分7~9分定义为中危组,评分10~12分定义为高危组[12]。
1.3 统计学分析
采用SPSS 31.0软件及Graphpad Prism进行统计分析。连续变量采用均数±标准差或中位数(四分位距)表示,组间比较采用两独立样本t检验或Mann-Whitney U检验;分类变量采用例数(百分比)表示,组间比较采用Pearson χ2检验或Fisher确切概率法。对于单因素分析结果中P < 0.05的变量纳入多因素模型,采用Logistic回归模型进行多因素分析。采用受试者工作特征(receiver operating characteristic, ROC)曲线确定肾动脉阻断时间对应AKI发生的最佳临界值。双侧P < 0.05为差异有统计学意义。
2 结果
2.1 患者基本特征
本研究共入组126例CKD 3期行肾部分切除手术的患者,其中男性97例(77%),女性29例(23%),平均年龄(69.76±8.86)岁。本组患者绝大多数为体检发现肾脏肿物(114例,90.5%),平均肿瘤直径为(3.22±1.76) cm。患者的既往合并症中,高血压90例(71.4%)、糖尿病44例(34.9%)、心脑血管疾病35例(27.8%)。术前诊断为CKD 3a期的患者94例(74.6%),CKD 3b期32例(25.4%)。术前依据R.E.N.A.L.评分分组,低危组45例(35.7%),中危组57例(45.2%),高危组24例(19.1%)。所有患者均进行了肾部分切除手术,其中,92例(73.0%)行腹腔镜手术,34例(27.0%)行机器人手术,中位手术时间143 (114, 178) min,中位肾动脉阻断时间20 (15, 26) min,术中中位出血量20 (15, 100) mL。术后组织病理诊断为透明细胞癌98例(77.8%),非透明细胞癌22例(17.4%),良性肿瘤6例(4.8%)。术后共有5例(3.9%)患者出现并发症,2例为术后出现发热(1例为术区包裹性积液形成,1例出现肺部感染),另3例分别为双下肢静脉血栓形成、贫血行输血治疗、淋巴瘘。
2.2 AKI危险因素的单因素分析
术后39例(31.0%)患者出现AKI,依据是否出现AKI对本组患者进行分组分析(表 1)。单因素分析结果显示,术后非AKI组与AKI组相比,机器人手术占比更高(33.3% vs. 12.8%, P=0.018),肾动脉阻断时间更短(中位18 min vs. 25 min,P < 0.001),术中出血更少(中位20 mL vs. 50 mL, P=0.028)。术后肾功能方面,AKI组的术后肌酐值[(185.56±102.11) μmol/L vs. (114.33±27.42) μmol/L,P < 0.001]、术后肌酐绝对增值[(64.74±84.25) μmol/L vs. (1.30±27.21) μmol/L,P < 0.001]和术后肌酐增长率[(57.43±92.16)% vs. (0.98±15.72)%, P < 0.001]均显著高于非AKI组。两组的其他人口学资料差异无统计学意义。
表1 AKI组与非AKI组基线资料对比Table 1 Comparison of baseline data between AKI group and non-AKI group |
| Variable | Non-AKI group (n=87) | AKI group (n=39) | χ2/t/Z | P |
| Gender, n (%) | 0.220 | 0.652 | ||
| Male | 68 (78.2) | 29 (74.4) | ||
| Female | 19 (21.8) | 10 (25.6) | ||
| Age/years, $\bar x \pm s$ | 70.34±9.01 | 68.46±8.48 | 1.104 | 0.272 |
| BMI/(kg/m2), $\bar x \pm s$ | 24.06±2.82 | 23.72±3.98 | 0.542 | 0.589 |
| Symptom, n (%) | 0.712 | 0.512 | ||
| Asymptomatic | 7 (8.0) | 5 (12.8) | ||
| Symptomatic | 80 (92.0) | 34 (87.2) | ||
| Comorbidity, n (%) | ||||
| Hypertension | 61 (70.1) | 29 (74.4) | 0.238 | 0.675 |
| Diabetes | 32 (36.8) | 12 (30.8) | 0.428 | 0.551 |
| Cardiovascular diseases | 23 (26.4) | 12 (30.8) | 0.252 | 0.669 |
| ASA grade, n (%) | 2.048 | 0.359 | ||
| Ⅰ | 4 (4.6) | 0 (0) | ||
| Ⅱ | 63 (72.4) | 31 (79.5) | ||
| Ⅲ-Ⅳ | 20 (23.0) | 8 (20.5) | ||
| Surgical approach, n (%) | 5.751 | 0.018 | ||
| Laparoscopic | 58 (66.7) | 34 (87.2) | ||
| Robotic | 29 (33.3) | 5 (12.8) | ||
| Tumor side, n (%) | 0.301 | 0.695 | ||
| Left | 40 (46.0) | 19 (51.4) | ||
| Right | 47 (54.0) | 18 (48.6) | ||
| Tumor size/cm, $\bar x \pm s$ | 3.11±1.97 | 3.47±1.13 | -1.081 | 0.282 |
| R.E.N.A.L. scores, n (%) | 3.199 | 0.202 | ||
| Low risk | 35 (40.2) | 10 (25.6) | ||
| Moderate risk | 35 (40.2) | 22 (56.4) | ||
| High risk | 17 (19.6) | 7 (18.0) | ||
| Duration of the surgery/min, M (P25, P75) | 136 (112, 169) | 155 (120, 196) | -1.887 | 0.059 |
| Duration of renal artery occlusion/min, M (P25, P75) | 18 (13, 25) | 25 (20, 30) | -4.257 | < 0.001 |
| Intraoperative bleeding/mL, M (P25, P75) | 20 (10, 50) | 50 (20, 200) | -2.200 | 0.028 |
| Complication, n (%) | 5 (5.7) | 4 (10.3) | 0.826 | 0.457 |
| Length of hospital stay/d, M (P25, P75) | 6 (5, 7) | 6 (4, 7) | -0.379 | 0.705 |
| Pathologic subtype, n (%) | 0.177 | 0.916 | ||
| ccRCC | 67 (77.0) | 31 (79.5) | ||
| Non-ccRCC | 16 (18.4) | 6 (15.4) | ||
| Benign tumor | 4 (4.6) | 2 (5.1) | ||
| Baseline creatinine/(μmol/L), $\bar x \pm s$ | 113.03±27.42 | 120.82±49.04 | -1.139 | 0.257 |
| CKD stage, n (%) | 0.860 | 0.381 | ||
| CKD 3a | 67 (77.0) | 27 (69.2) | ||
| CKD 3b | 20 (23.0) | 12 (30.8) | ||
| Postoperative creatinine/(μmol/L), $\bar x \pm s$ | 114.33±27.42 | 185.56±102.11 | -5.850 | < 0.001 |
| Absolute increase in creatinine/(μmol/L), $\bar x \pm s$ | 1.30±27.21 | 64.74±84.25 | -6.747 | < 0.001 |
| Creatinine elevation rate/%, $\bar x \pm s$ | 0.98±15.72 | 57.43±92.16 | -5.561 | < 0.001 |
AKI, acute kidney injury; BMI, body mass index; ASA, American Society of Anesthesiologists; R.E.N.A.L., radius, exophytic/endophytic, nearness, anterior/posterior, location; ccRCC, clear cell renal cell carcinoma; CKD, chronic kidney disease. |
2.3 AKI危险因素的多因素分析
依据单因素分析结果,将手术方式、肾动脉阻断时间和术中出血量纳入多因素Logistic回归模型,分析显示,肾动脉阻断时间(OR=1.105, 95%CI: 1.041~1.173, P=0.001)和术中出血量(OR=1.004, 95%CI: 1.000~1.007, P=0.046)是肾部分切除术后发生AKI的独立危险因素(表 2)。
表2 肾部分切除术后发生AKI的多因素Logistic回归模型分析Table 2 Multivariate Logistic regression model analysis of AKI occurrence after partial nephrectomy |
| Variable | OR | 95%CI | Wald | Pa |
| Surgical approach | ||||
| Laparoscopic | Reference | Reference | Reference | |
| Robotic | 0.302 | 0.086-1.067 | 3.458 | 0.063 |
| Duration of renal artery occlusion | 1.105 | 1.041-1.173 | 10.758 | 0.001 |
| Intraoperative bleeding | 1.004 | 1.000-1.007 | 16.788 | 0.046 |
a, P value refers to multivariate Logistic regression with enter methods. AKI, acute kidney injury. |
2.4 肾动脉阻断时间对术后发生AKI的影响
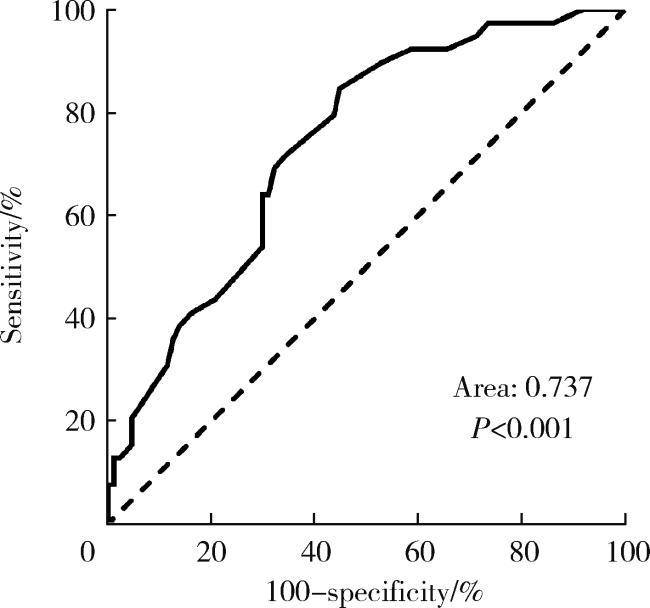
采用ROC曲线对肾动脉阻断时间对应AKI发生进行截断值筛选,ROC曲线下面积为0.737,提示肾动脉阻断时间对术后AKI具有良好区分度(图 1)。依据最大约登指数(Youden index),选取18 min作为最佳截断值,肾动脉阻断时间≥18 min的患者共有81例,其中35例术后出现AKI,AKI发生率为43.2%;肾动脉阻断时间 < 18 min的患者共有45例,术后仅有4例患者出现AKI,AKI发生率为8.8%,两组间差异有统计学意义(P < 0.001)。
3 讨论
本研究探讨了CKD 3期患者行肾部分切除术后AKI的发生情况及危险因素,结果显示,在126例CKD 3期患者中,术后AKI发生率为31.0%(39/126),与以往文献报道的肾部分切除术后AKI发生率(22%~43.9%)基本一致[2-5]。多因素分析表明,肾动脉阻断时间和术中出血量是CKD 3期患者术后发生AKI的独立危险因素。进一步ROC曲线分析显示,肾动脉阻断时间预测AKI的曲线下面积为0.737,最佳截断值为18 min,阻断时间≥18 min的患者AKI发生率显著升高(43.2% vs. 8.8%,P < 0.001)。此外,单因素分析中,机器人手术比腹腔镜手术具有更低的AKI发生率,但在多因素分析中该结果差异没有统计学意义。
缺血-再灌注损伤是肾部分切除术后AKI的核心机制之一。本研究证实,肾动脉阻断时间是CKD 3期患者术后AKI的独立危险因素(OR=1.105,95%CI:1.041~1.173,P=0.001),且随着阻断时间延长,AKI风险呈持续增加趋势,这一结果与既往多项研究结论一致。当肾动脉阻断时间从 < 10 min延长至>20 min时,低风险患者术后发生AKI的绝对风险从13%增加到28%,绝对风险增加了15%;而高风险患者术后发生AKI的绝对风险从31%急剧升高至77%,绝对风险增加了46%[15]。Obrecht等[8]对于机器人辅助肾部分切除术的研究同样发现,热缺血时间超过17 min与术后发生AKI呈显著相关(OR=0.1,P < 0.001),并提出17 min可作为预测AKI发生的重要阈值。
本研究通过ROC曲线确定的最佳截断值为18 min,与上述研究高度吻合。这一阈值的临床意义在于,对于CKD 3期患者,由于肾功能储备已显著下降,肾单位对缺血的耐受性更差,因此,即使相对较短的热缺血时间也可能导致不可逆的肾小管损伤。基础研究表明,肾缺血-再灌注损伤涉及线粒体功能障碍、活性氧产生、炎症反应激活及细胞凋亡等多重机制[16]。当热缺血时间超过35 min,肾小管上皮细胞可出现明显的亚致死性损伤,即使在血流恢复后,细胞修复过程仍可能不完全,导致部分肾单位永久性丧失功能[17]。值得注意的是,本研究纳入的均为CKD 3期患者,其eGFR已降至30~59 mL/(min·1.73 m2),这类患者的肾血管自动调节能力减弱,对缺血的敏感性更高。Schmid等[18]的研究表明,术前CKD分期与术后发生AKI风险呈显著正相关,CKD 3期患者较肾功能正常者发生AKI的风险增加26倍以上(OR=26.49,P=0.02),提示对于CKD 3期患者,即使手术技术娴熟,阻断时间控制良好,仍应保持高度警惕并尽可能缩短热缺血时间。
本研究发现,术中出血量是CKD 3期患者术后AKI的另一独立危险因素(OR=1.004,95%CI:1.000~1.007,P=0.046)。尽管效应值较小,但考虑到临床实践中出血量的波动范围可达数百毫升,其对AKI的累积效应不容忽视。Li等[19]的研究同样证实,围术期贫血是肾部分切除术后AKI的强预测因子(OR=31.272),且血红蛋白下降幅度对AKI的预测价值最高(曲线下面积=0.784)。术中出血导致AKI的机制可从以下几方面理解:(1)大量失血可引起有效循环血量减少,肾灌注压下降,激活肾素-血管紧张素-醛固酮系统,导致肾血管收缩和肾血流量进一步减少[20];(2)失血引起的低血压可加重已存在的缺血性损伤,尤其对于经历肾动脉阻断的肾脏,缺血后再灌注期若合并全身低灌注,将加剧线粒体损伤和氧化应激反应[21];(3)失血后,输血需求本身也可能带来额外的肾损伤风险,库存血中的游离血红蛋白、炎性介质和微聚物均可对肾小管造成直接损伤[22]。对于CKD 3期患者,其对失血的耐受性较肾功能正常的患者更差。慢性肾功能不全状态下,肾小管上皮细胞的修复能力下降,抗氧化防御系统功能受损,使得细胞更容易发生凋亡和坏死[23]。因此,在手术过程中精细解剖、减少出血对于保护肾功能至关重要。本研究的单因素分析中,机器人手术可降低AKI风险,但在多因素分析中未呈现出来(P=0.063),其原因可能是,机器人手术的优势部分通过缩短肾动脉阻断时间及减少出血间接体现,当这两项独立危险因素纳入模型后,手术方式的直接效应被稀释;此外,本研究中行机器人手术的例数较少(34例),AKI事件数有限,可能影响统计效能,未来需扩大样本量进一步验证。
本研究存在以下局限性:(1)单中心回顾性设计可能存在选择偏倚和信息偏倚,尽管是连续入组患者,但无法完全排除混杂因素的影响;(2)AKI的判定主要依据血清肌酐变化,未常规监测尿量,可能导致部分少尿型AKI漏诊;(3)未收集术后远期肾功能数据,无法评估AKI对CKD进展的影响;(4)未分析肾动脉阻断方式(动脉单独阻断vs. 动静脉同时阻断)对肾功能的影响,既往有荟萃分析研究提示,肾动脉阻断技巧可能与肾功能预后相关[24]。
综上所述,CKD 3期患者行肾部分切除术后AKI的发生率为31.0%,肾动脉阻断时间和术中出血量是术后AKI的独立危险因素。肾动脉阻断时间≥18 min者AKI风险显著增加。对于CKD 3期这一高危人群,进行术前充分评估、术中精细操作以缩短阻断时间并减少出血,是保护肾功能的关键策略。