1 资料与方法
1.1 研究对象
1.2 尿液样本的处理
1.3 仪器和分析条件
1.4 数据处理
1.5 统计学分析
1.5.1 临床基线特征分析
1.5.2 多变量模式识别分析
1.5.3 差异有机酸筛选与KEGG富集分析
1.5.4 机器学习建模与内部验证
2 结果
2.1 患者的一般情况
表1 研究对象的临床和人口统计学特征Table 1 Clinical and demographic characteristics of the study population |
| Clinical and demographic characteristics | Stone group(n=99) | Non-stone group(n=57) | P |
| Male, n (%) | 72(72.7) | 21(56.1) | 0.027 |
| Age/years,$\bar x \pm s$ | 56.8±12.3 | 53.4±11.7 | 0.087 |
| Complicated with diabetes, n (%) | 23(23.2) | 8(14.0) | 0.120 |
| Complicated with hypertension, n (%) | 31(31.3) | 12(21.1) | 0.126 |
| Recurrence | 28(28.3) | - | - |
2.2 结石患者与非结石患者尿有机酸代谢谱的组间差异及协变量影响分析
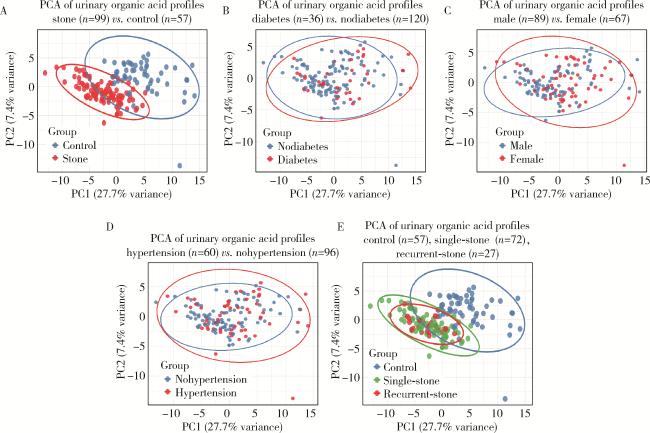
图1 泌尿系结石患者与非结石患者尿有机酸代谢谱的主成分分析Figure 1 Principal component analysis of urinary organic acid profiles in patients with urolithiasis and controls A, principal component analysis (PCA) comparing stone patients (n=99, red) and healthy controls (n=57, blue), PC1 (27.7%) and PC2 (7.4%) show a clear separation trend, indicating distinct metabolic profiles between stone patients and healthy controls; B, PCA stratified by diabetes status, comparing stone patients with diabetes (n=36, red) and stone patients without diabetes (n=120, blue), and the extensive overlap of confidence ellipses suggests that diabetes has minimal impact on the urinary organic acid profile; C, PCA stratified by gender, comparing males (n=89, blue) and females (n=67, red), and the clear separation between groups indicates that gender is an important covariate affecting urinary organic acid profiles; D, PCA stratified by hypertension status, comparing stone patients with hypertension (n=60, red) and stone patients without hypertension (n=96, blue), and the extensive overlap suggests that hypertension is not a key covariate influencing the urinary organic acid profile; E, PCA comparing healthy controls (n=57, blue), single-stone patients (n=72, green), and recurrent-stone patients (n=27, red), and the controls are clearly separated from both stone groups, while single-stone and recurrent-stone patients show substantial overlap, indicating similar metabolic profiles. |
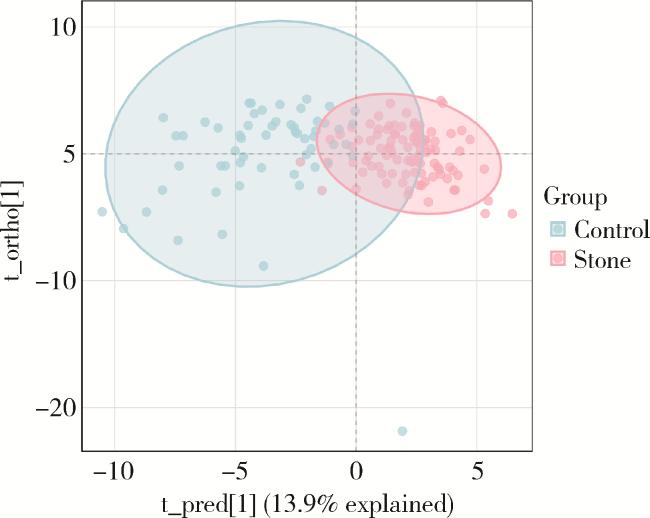
图2 泌尿系结石患者与非结石患者尿有机酸代谢谱的正交偏最小二乘判别分析得分图Figure 2 Orthogonal partial least squares discriminant analysis score plot of urinary organic acid profiles in urolithiasis patients and controls The OPLS-DA model clearly demonstrates the distribution of the stone group (red) and control group (blue) along the predictive principal component (t_pred[1], explaining 13.9% of variance) and the orthogonal principal component (t_ortho[1]); A significant separation trend was observed between the two groups along the t_pred[1] axis, with only minor overlap at the edges, indicating substantial differences in urinary organic acid metabolic profiles; The model fit parameters were R2X =0.139, R2Y =0.48, and the predictive ability parameter Q2 =0.457, indicating good explanatory power, predictive stability, and no significant overfitting. OPLS-DA, orthogonal partial least squares discriminant analysis. |
2.3 结石患者与非结石患者的差异代谢物筛选与核心贡献代谢物分析
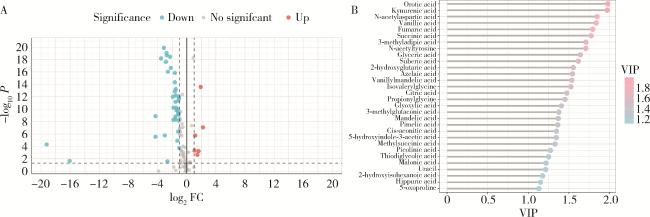
图3 泌尿系结石患者与非结石患者差异有机酸筛选及核心代谢物贡献度分析Figure 3 Screening of differentially expressed organic acids and contribution analysis of key metabolites in urolithiasis patients vs. controls A, compared with the control group, a total of 44 organic acids with significant differences were identified in the stone group (P < 0.05), including 6 significantly up-regulated (red) and 38 significantly down-regulated (blue) metabolites; B, the top 30 organic acids with the highest contribution to metabolic separation between groups are shown; The top 10 key metabolites ranked by VIP value are: Orotic acid, kynurenic acid, N-acetylaspartic acid, vanillic acid, fumaric acid, Succinic acid, 3-methyladipic acid, N-acetyltyrosine, glyceric acid, and suberic acid, which are the critical molecules driving the metabolic differences between the two groups. VIP, variable importance in projection; FC, fold change. |
2.4 差异有机酸KEGG通路富集分析
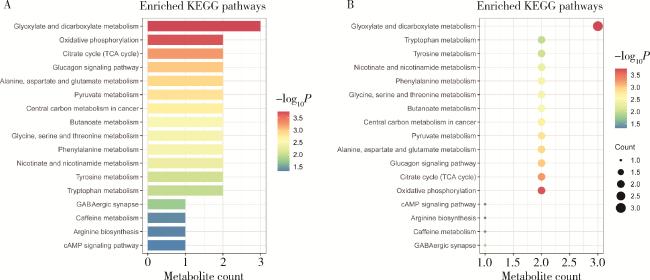
图4 差异有机酸富集的KEGG通路分析Figure 4 KEGG pathway enrichment analysis of differentially expressed organic acids A, bar chart showing the KEGG pathways significantly enriched by the differentially expressed organic acids, the results show that glyoxylate and dicarboxylate metabolism, oxidative phosphorylation, and the citrate cycle (TCA cycle) are the most significantly enriched pathways, suggesting that the development of urolithiasis is closely related to disturbances in energy metabolism and central carbon metabolism; B, bubble plot further illustrating the characteristics of the enriched pathways, the glyoxylate and dicarboxylate metabolism pathway has the highest number of metabolites and the strongest significance, while oxidative phosphorylation and the citrate cycle also show significant enrichment, further confirming the central role of energy and central carbon metabolism in the pathogenesis of urolithiasis. KEGG, kyoto encyclopedia of genes and genomes; TCA, tricarboxylic acid cycle; GABAergic, gamma-aminobutyric acid-ergic. |
2.5 机器学习筛选核心代谢物及区分效能验证
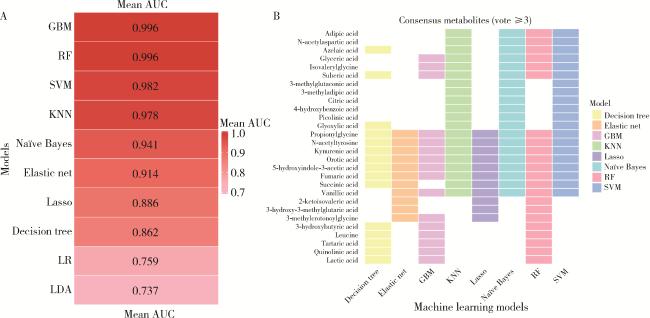
图5 基于差异有机酸的泌尿系结石机器学习模型分析Figure 5 Machine learning analysis of urinary calculi using differential organic acids A, bar chart of mean AUC values for different machine learning models, GBM and RF achieved the highest mean AUC of 0.996, followed by SVM, and KNN, indicating that urinary organic acid metabolites can effectively distinguish stone patients from healthy controls; B, heatmap of consensus metabolites (vote ≥ 3); Key metabolites consistently selected by at least 3 models are shown, including orotic acid, kynurenic acid, succinic acid, and fumaric acid, which serve as core biomarkers for the diagnosis of urolithiasis. VIP, variable importance in projection; FC, fold change; AUC, area under the curve; GBM, gradient boosting machine; RF, fandom forest; SVM, support vector machine; KNN, K-nearest neighbors; LR, Logistic regression; LDA, linear discriminant analysis. |
2.6 共识代谢物的区分效能及表达验证
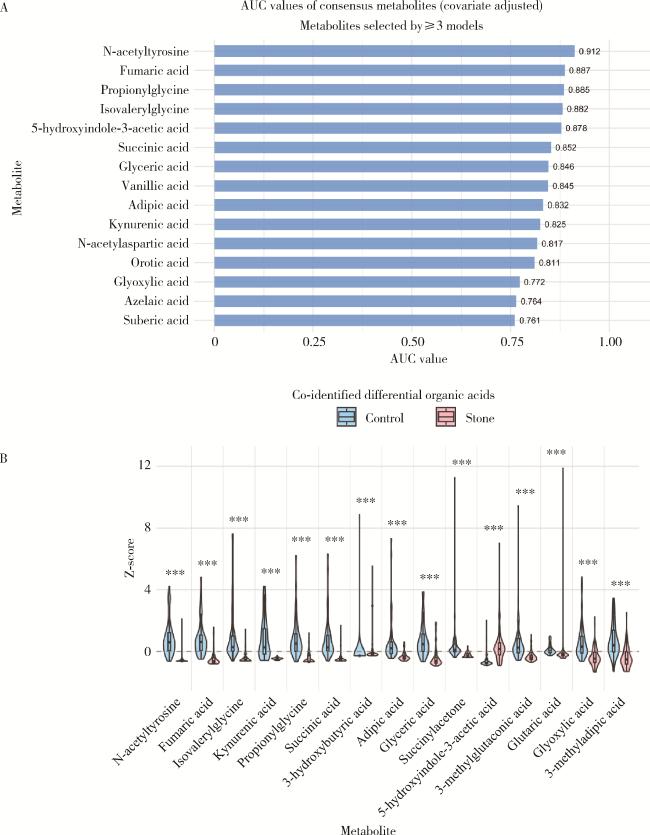
图6 共识代谢物的诊断效能及组间表达差异分析Figure 6 AUC plot and violin plot of consensus urinary organic acids A, bar chart of AUC values for consensus metabolites after covariate adjustment, N-acetyltyrosine achieved the highest AUC value of 0.912, while fumaric acid (0.887) and propionylglycine (0.885) also exhibited high diagnostic efficacy, indicating their potential as independent diagnostic biomarkers for urolithiasis; B, violin plot of co-identified differential organic acids, blue represents the control group, and pink represents the stone group, with Z-score as the normalized expression level, all displayed metabolites showed significant differences between the two groups (P < 0.001), further validating their reliability as diagnostic biomarkers for urolithiasis. * * *P < 0.001. AUC, area under the curve. |
2.7 核心代谢物组合的筛选与效能验证
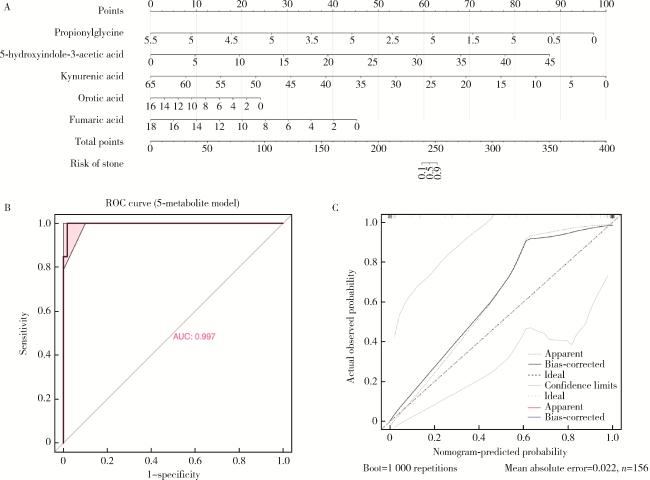
图7 核心代谢物组合对泌尿系结石的区分效能分析Figure 7 Discrimination efficiency of core metabolite panel for urolithiasis A, metabolite combination panel: Integrates the expression levels of five metabolites, propionylglycine, 5-Hydroxyindole-3-acetic acid, kynurenic acid, orotic acid, and fumaric acid to calculate a total score for reflecting metabolic abnormality associated with urolithiasis; B, ROC curve of the 5-metabolite model, the area under the curve is 0.997, indicating excellent performance in distinguishing patients with urolithiasis from controls; C, calibration curve, the bias-corrected curve closely aligns with the ideal curve, with a mean absolute error of 0.022, demonstrating good calibration and stability of the metabolite combination model. ROC, receiver operating characteristic; AUC, area under the curve. |