1 资料与方法
1.1 临床病例资料
表1 接受ADT治疗患者临床信息Table 1 Clinical information of the patients undergoing ADT treatment |
| Case | Age/years | Baseline PSA/(μg/L) | f/t PSA | Gleason score | Clinical stage |
| 1 | 79 | 23.21 | 0.09 | 3+4 | T4N0M0 |
| 2 | 84 | 25.64 | 0.09 | 4+3 | T2N0M0 |
| 3 | 77 | 68.44 | 0.05 | 4+5 | T3bN0M0 |
| 4 | 81 | 18.63 | 0.07 | 3+4 | T1cN0M0 |
| 5 | 81 | 9.06 | 0.14 | 3+4 | T2N0M0 |
| 6 | 77 | 13.61 | 0.23 | 3+3 | T1cN0M0 |
| 7 | 64 | 65.84 | 0.07 | 4+3 | T2N0M1b |
| 8 | 80 | 76.27 | 0.2 | 3+4 | T2N0M1b |
| 9 | 64 | 172.70 | 0.08 | 4+3 | T4N1M1b |
| 10 | 83 | 18.17 | 0.24 | 3+3 | T2N0M0 |
| 11 | 83 | 17.86 | 0.11 | 4+4 | T4N0M0 |
| 12 | 85 | 15.08 | 0.08 | 4+3 | T4N0M0 |
PSA, prostate specific antigen; ADT, androgen deprivation therapy. |
1.2 血清学及激素监测
1.3 外周血免疫细胞及细胞因子检测
1.4 PDX模型转录组学分析
1.5 单细胞RNA测序
2 结果
2.1 ADT显著降低PSA及雄激素水平,但对外周免疫状态影响有限
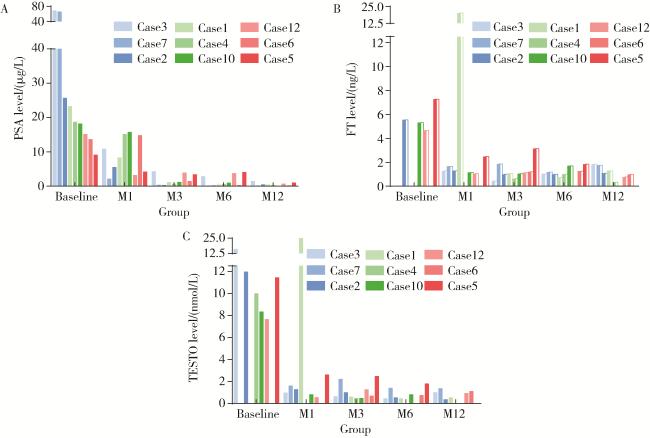
图1 接受ADT治疗的前列腺癌患者血清PSA和雄激素变化趋势Figure 1 Trends of serum PSA and androgen changes in prostate cancer patients undergoing ADT treatment The dynamic changes of serum PSA (A), serum free testosterone (B), and serum testosterone (C) in 12 patients undergoing ADT treatment over a one-year period. PSA, prostate specific antigen; ADT, androgen deprivation therapy. |
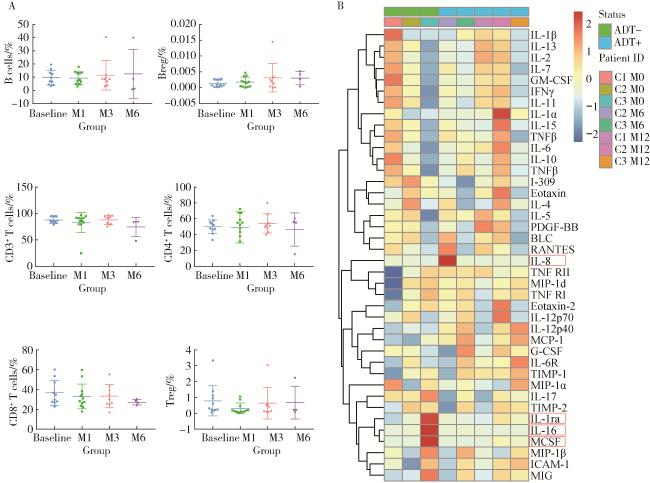
图2 接受ADT治疗的前列腺癌患者外周血免疫细胞及免疫相关因子动态变化Figure 2 Dynamic changes of peripheral blood immune cells and immune-related factors in prostate cancer patients undergoing ADT treatment Flow cytometry was used to detect the changes in the proportion of peripheral blood immune cells in patients before and after ADT treatment (A), and antibody arrays were used to detect the changes in immune-related factors (B). IL, interleukin; GM-CSF, granulocyte-macrophage colony-stimulating factor; IFN, interferon; TNF, tumor necrosis factor; PDGF, platelet derived growth factor; BLC, B lymphocyte chemoattractant; RANTES, regulated on activation normal T cell expressed and secreted; MIP, major intrinsic protein of lens fiber; MCP, membrane cofactor protein; G-CSF, granulocyte colony-stimulating factor; TIMP, tissue inhibitor of metalloproteinases; MCSF, macrophage colony-stimulating factor, ICAM, intercellular adhesion molecule; MIG, monokine induced by interferon-γ. |
2.2 去势诱导前列腺癌PDX模型基因表达及免疫微环境重编程
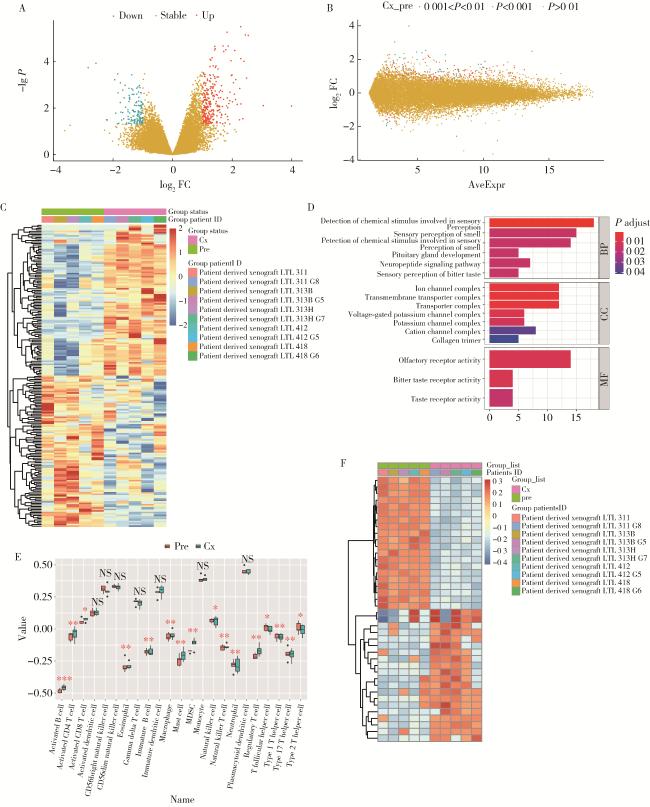
图3 转录组学分析去势对前列腺癌PDX组织基因表达及肿瘤微环境的影响Figure 3 Transcriptomic analysis of the effects of castration on gene expression and tumor microenvironment in prostate cancer PDX tissues RNAseq data from five prostate cancer PDX models of GEO (GSE41193) were analyzed before and after surgical castration. Differential genes were displayed, with A being a volcano plot, B being a MA plot, C being a Top200 differential gene heatmap, and D being a GO analysis. ssGSEA was applied to analyze the expression ratios of various immune cells before and after surgical castration, and Wilcoxon rank-sum test was used for inter-group difference comparison, with *P < 0.05, * *P < 0.01, * * *P < 0.001 (E). GSVA was also applied to perform enrichment analysis on immune-related pathways, with NES >1 and FDR < 0.05 as the significant criteria for pathway enrichment (F). FC, fold change; PDX, patient-derived tumor xenograft; GEO, gene expression omnibus; MA, mean-difference; GO, gene expression omnibus; ssGSEA, single-sample gene set enrichment analysis; GSVA, gene set variation analysis; NES, normalized enrichment score; FDR, false discovery rate. |
2.3 ADT治疗后肿瘤微环境细胞的组成
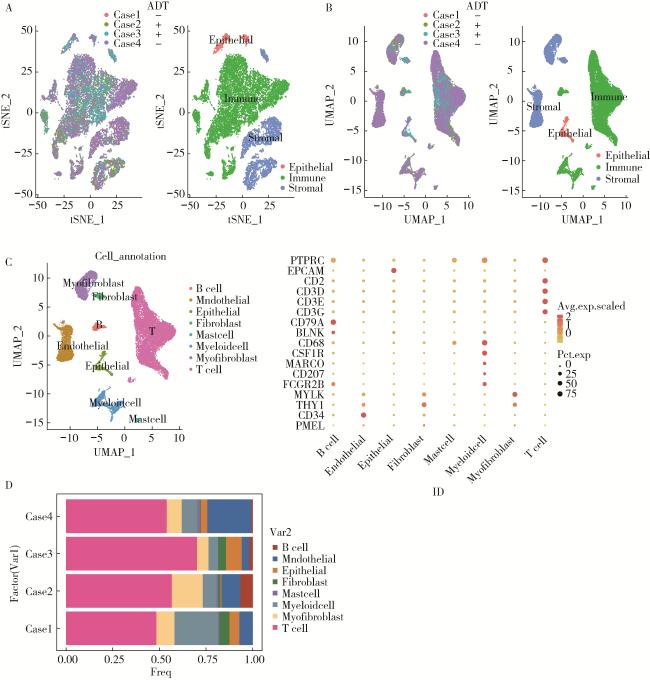
图4 四例前列腺癌组织scRNAseq数据细胞初次分群(两例接受ADT治疗)Figure 4 Initial cell clustering of scRNAseq data from four prostate cancer tissues (two cases received ADT treatment) Using marker genes, single cells were initially grouped into three major populations: immune cells, stromal cells, and epithelial cells, which were then visualized using tSNE (A) and UMAP (B). Subsequently, subpopulation analysis was performed on these three major populations, resulting in the identification of eight subpopulations (C). The distribution of each subpopulation in each case was statistically presented (D). tSNE, t-distributed stochastic neighbor embedding; UMAP, uniform manifold approximation and projection. |
2.4 ADT治疗后T细胞亚群分布的变化
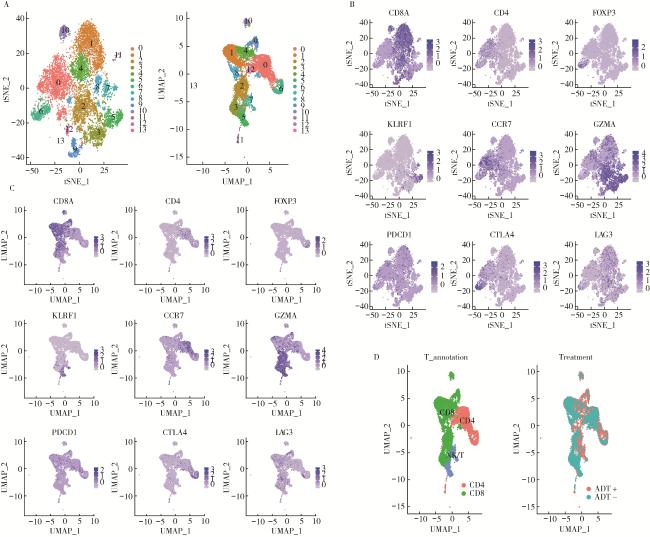
图5 前列腺癌T细胞亚群分群注释Figure 5 Annotation of T-cell subpopulations in prostate cancer Through clustering analysis of T cells, a total of 14 T cell subpopulations were obtained (A). T cell subpopulation markers were used to annotate the subpopulations (B, C), with a focus on the expression of CD4+T cells and CD8+T cells in different groups (D). |
2.5 ADT抑制T细胞细胞毒功能并下调干扰素通路
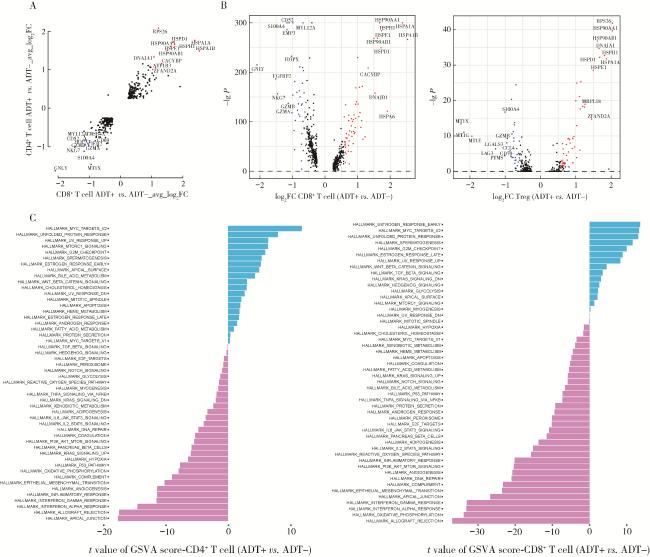
图6 ADT治疗对T细胞功能的影响Figure 6 Effect of ADT treatment on T cell function After ADT treatment, the expression of genes related to T cells and cytotoxicity was downregulated (A). Specifically, the expression of NKG7, GZMB, and GZMA in CD8+T cells was significantly downregulated, and the expression of genes related to T regulatory cell function, such as CCL4, LGALS3, and LAG3, also showed a downward trend. GSVA enrichment analysis was performed on the differential genes of CD4+T cells and CD8+T cells in the Hallmark 50 gene pathways. ADT treatment led to the downregulation of the interferon pathway (C). ADT, androgen deprivation therapy; FC, fold change; GSVA, gene set variation analysis. |