Journal of Peking University (Health Sciences) ›› 2026, Vol. 58 ›› Issue (4): 738-747. doi: 10.19723/j.issn.1671-167X.2026.04.009

Previous Articles     Next Articles

Characteristics of urinary organic acid metabolic profile and screening of key metabolic markers in patients with urolithiasis

Zixuan QI1, Xiaolong BIAN1, Haopu HU1, Cong TIAN1, Chenlong WANG1, Yumou ZHOU1, Tao XU1, Hui WANG2, Linlin CAO2, Hao HU1,*()   

  1. 1. Department of Urology, Peking University People' s Hospital, Beijing 100044, China
    2. Department of Clinical Laboratory, Peking University People' s Hospital, Beijing 100044, China
  • Received:2026-03-02 Online:2026-08-18 Published:2026-05-27
  • Contact: Hao HU

RICH HTML


Abstract:

Objective: To systematically compare the differences in urinary organic acid metabolic profiles between patients with urinary calculi and non-calculi individuals, to screen disease-specific characteristic metabolic biomarkers and key signaling pathways, and to elucidate the potential mechanism underlying the occurrence and progression of urinary calculi at the metabolic level, so as to provide a theoretical basis for basic research and screening of intervention targets for urinary calculi. Methods: A total of 99 patients with urinary calculi and 57 non-calculi subjects were enrolled. Twenty-four-hour urine samples were collected and subjected to untargeted urinary organic acid metabolomics detection by gas chromatography-mass spectrometry (GC-MS). Principal component analysis (PCA) and orthogonal partial least squares discriminant analysis (OPLS-DA) were used to analyze the differences in metabolic profiles between the groups and the effects of clinical covariates. Volcano plot and variable importance in the projection (VIP) analysis were applied to screen differential organic acids. The Kyoto Encyclopedia of Genes and Genomes (KEGG) database were used for metabolic pathway enrichment analysis. Machine learning algorithms were adopted to screen the most representative core metabolite combinations and verify the discriminatory efficacy of organic acids for disease status. Results: The urinary organic acid metabolic profiles showed a significant separation trend between the calculi group and the non-calculi group (OPLS-DA: R2X =0.139, R2Y =0.48, Q2 =0.457). Gender was an important covariate affecting metabolic profiles, while diabetes, hypertension and stone recurrence status exerted no significant influence. A total of 44 differential organic acids were screened (P < 0.05), including 6 upregulated and 38 downregulated metabolites. Ten core differential metabolites were identified via VIP analysis (P < 0.001, all downregulated). Differential organic acids were mainly enriched in energy metabolism pathways such as glyoxylate and dicarboxylate metabolism, as well as amino acid metabolism pathways including tryptophan metabolism. Among machine learning models, Gradient Boosting Machine and Random Forest exhibited the optimal efficacy with an average area under the curve (AUC) of 0.996. Five core metabolites including propionylglycine, 5-hydroxyindole-3-acetic acid, kynurenic acid, orotic acid and fumaric acid were identified as the optimal combination. The nomogram model constructed based on this combination yielded an AUC of 0.997; after calibration bias correction, the calibration curve was highly consistent with the ideal curve, with a mean absolute error of 0.022, which could effectively distinguish calculi patients from non-calculi individuals. Conclusion: Patients with urinary calculi present obvious disorders in urinary organic acid metabolism, which are mainly involved in energy and amino acid metabolic pathways and closely associated with the pathogenesis of urinary calculi. The five core metabolites (propionylglycine, 5-hydroxyindole-3-acetic acid, kynurenic acid, orotic acid and fumaric acid) can effectively distinguish calculi from non-calculi populations, and can serve as representative metabolic biomarkers to provide novel targets for subsequent mechanism exploration and targeted intervention.

Key words: Urolithiasis, Urinary organic acids, Metabolomics, Urology

CLC Number: 

  • R691.4

Table 1

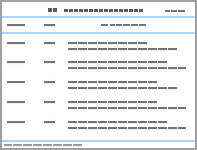
Clinical and demographic characteristics of the study population"

Clinical and demographic characteristics Stone group(n=99) Non-stone group(n=57) P
Male, n (%) 72(72.7) 21(56.1) 0.027
Age/years,$\bar x \pm s$ 56.8±12.3 53.4±11.7 0.087
Complicated with diabetes, n (%) 23(23.2) 8(14.0) 0.120
Complicated with hypertension, n (%) 31(31.3) 12(21.1) 0.126
Recurrence 28(28.3) - -

Figure 1

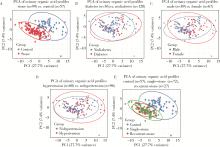
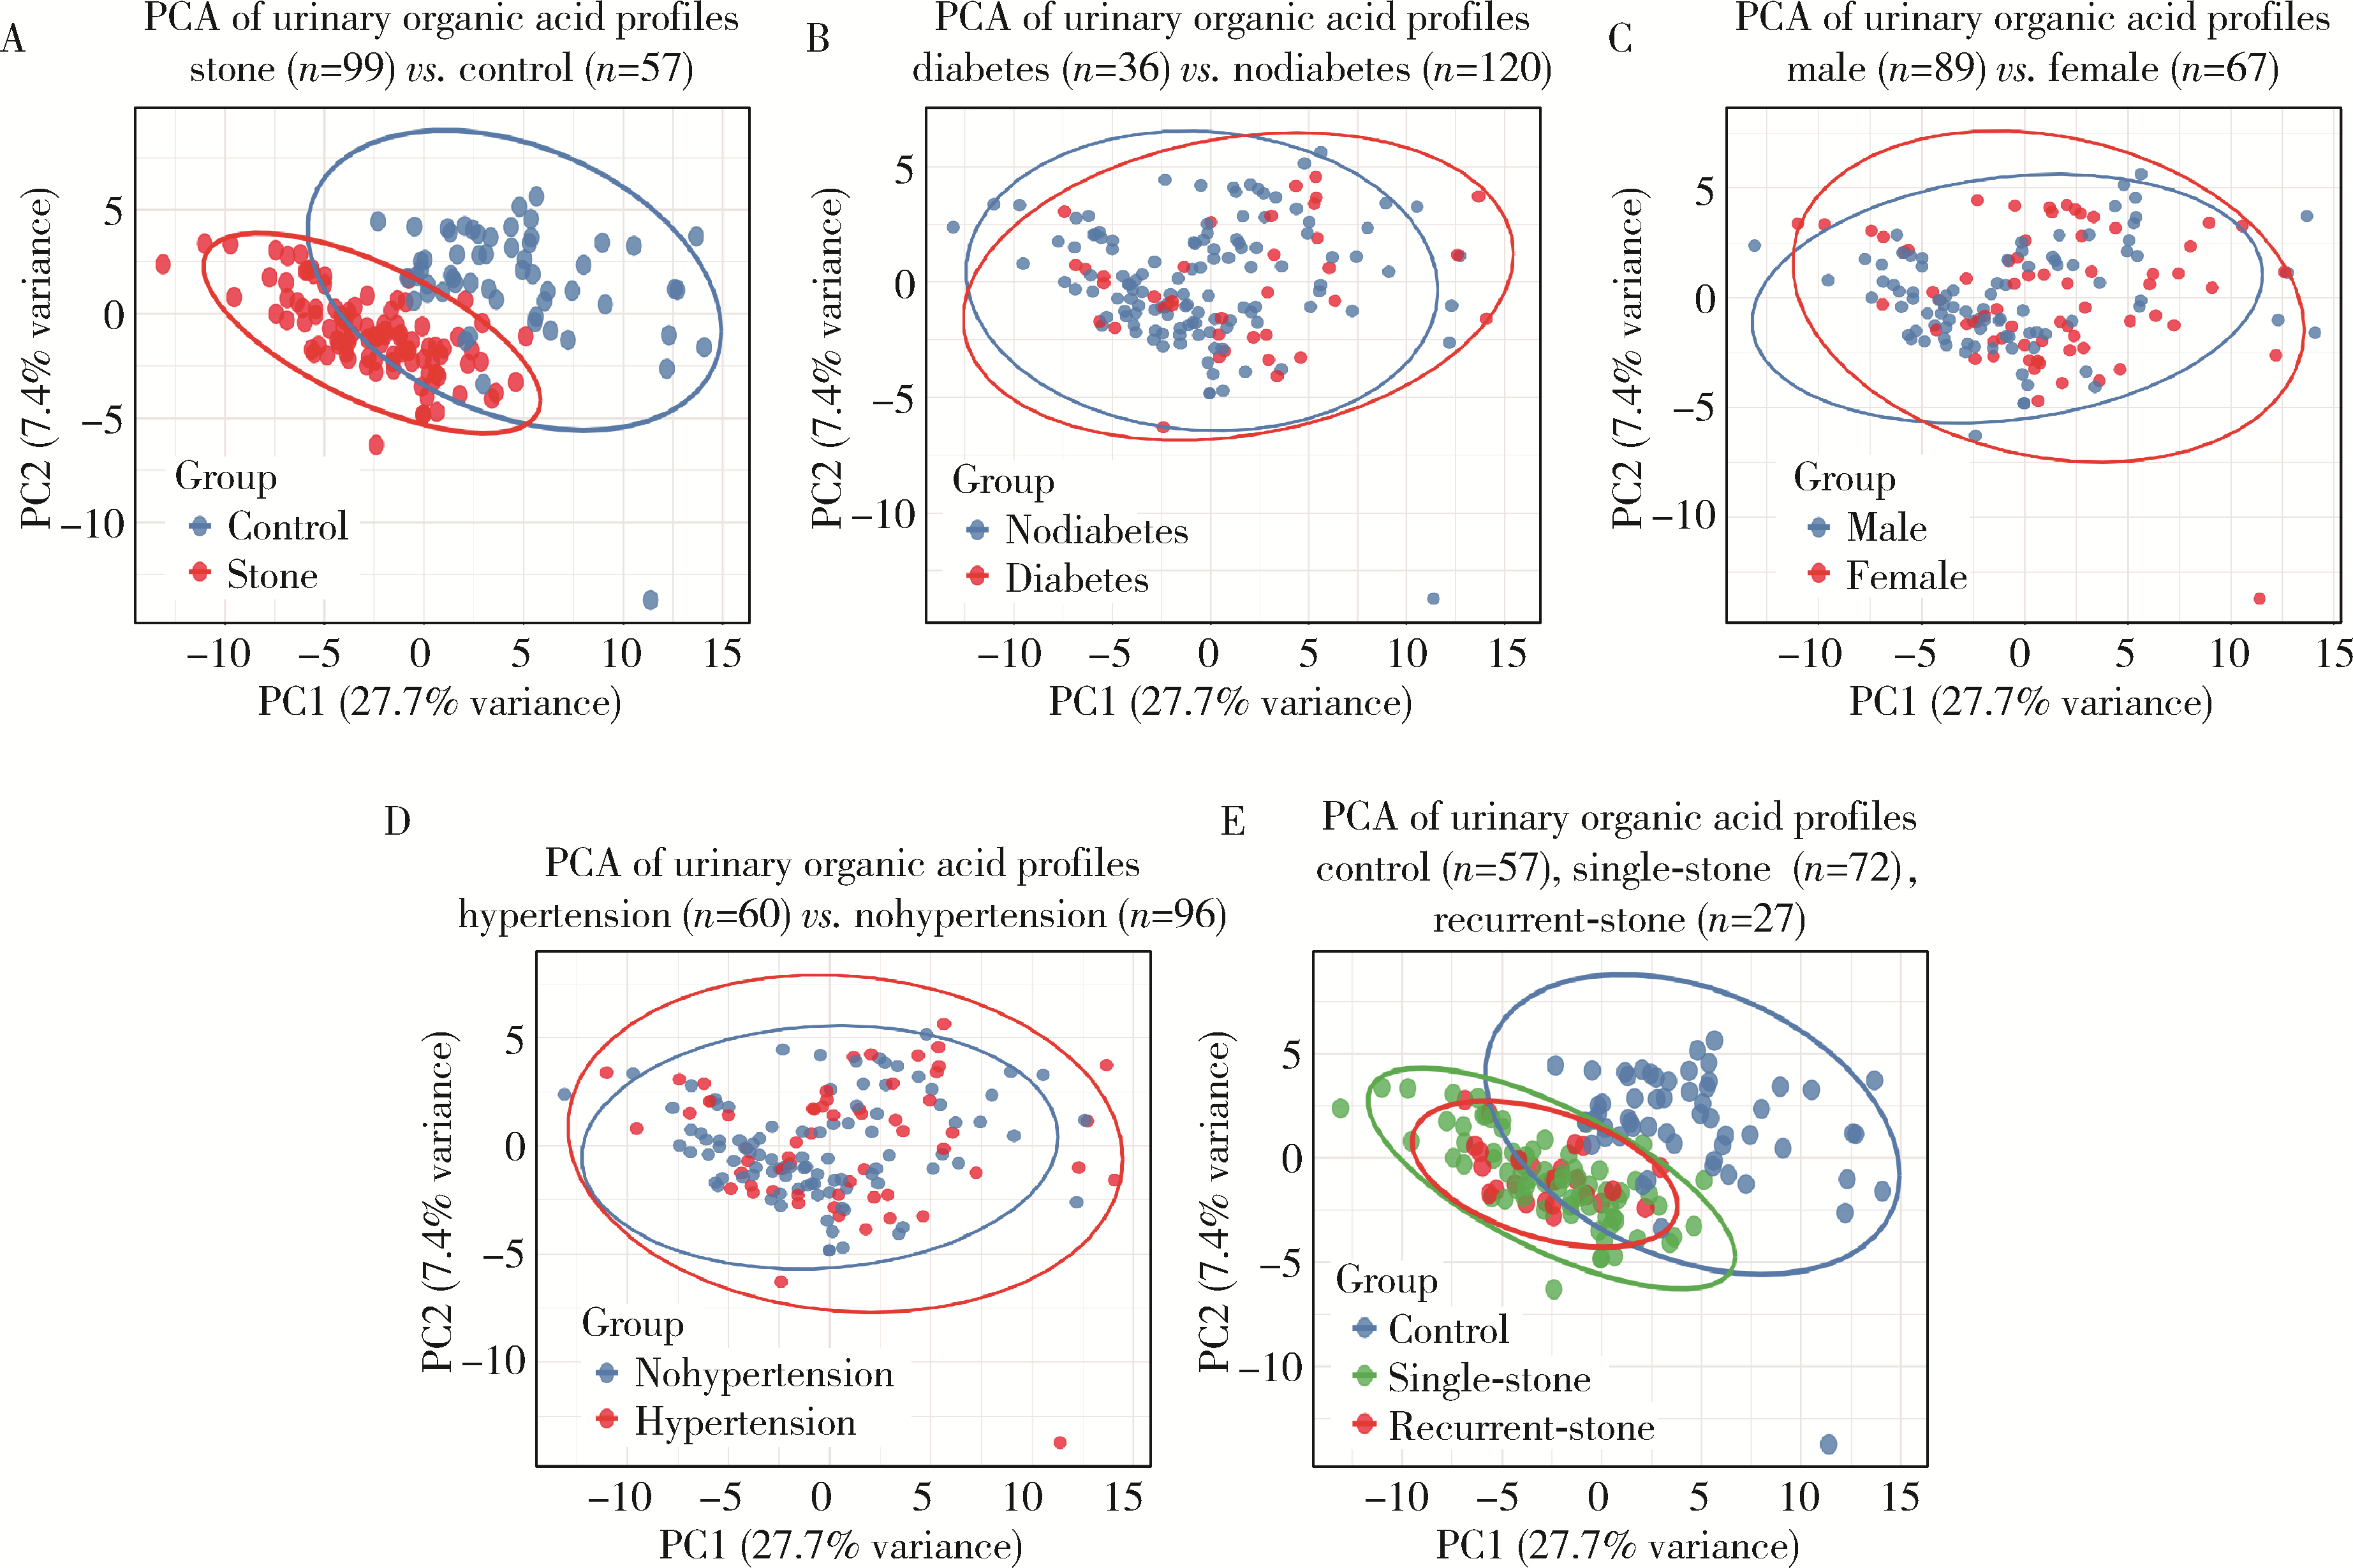
Principal component analysis of urinary organic acid profiles in patients with urolithiasis and controls A, principal component analysis (PCA) comparing stone patients (n=99, red) and healthy controls (n=57, blue), PC1 (27.7%) and PC2 (7.4%) show a clear separation trend, indicating distinct metabolic profiles between stone patients and healthy controls; B, PCA stratified by diabetes status, comparing stone patients with diabetes (n=36, red) and stone patients without diabetes (n=120, blue), and the extensive overlap of confidence ellipses suggests that diabetes has minimal impact on the urinary organic acid profile; C, PCA stratified by gender, comparing males (n=89, blue) and females (n=67, red), and the clear separation between groups indicates that gender is an important covariate affecting urinary organic acid profiles; D, PCA stratified by hypertension status, comparing stone patients with hypertension (n=60, red) and stone patients without hypertension (n=96, blue), and the extensive overlap suggests that hypertension is not a key covariate influencing the urinary organic acid profile; E, PCA comparing healthy controls (n=57, blue), single-stone patients (n=72, green), and recurrent-stone patients (n=27, red), and the controls are clearly separated from both stone groups, while single-stone and recurrent-stone patients show substantial overlap, indicating similar metabolic profiles."

Figure 2

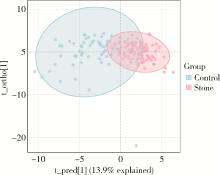
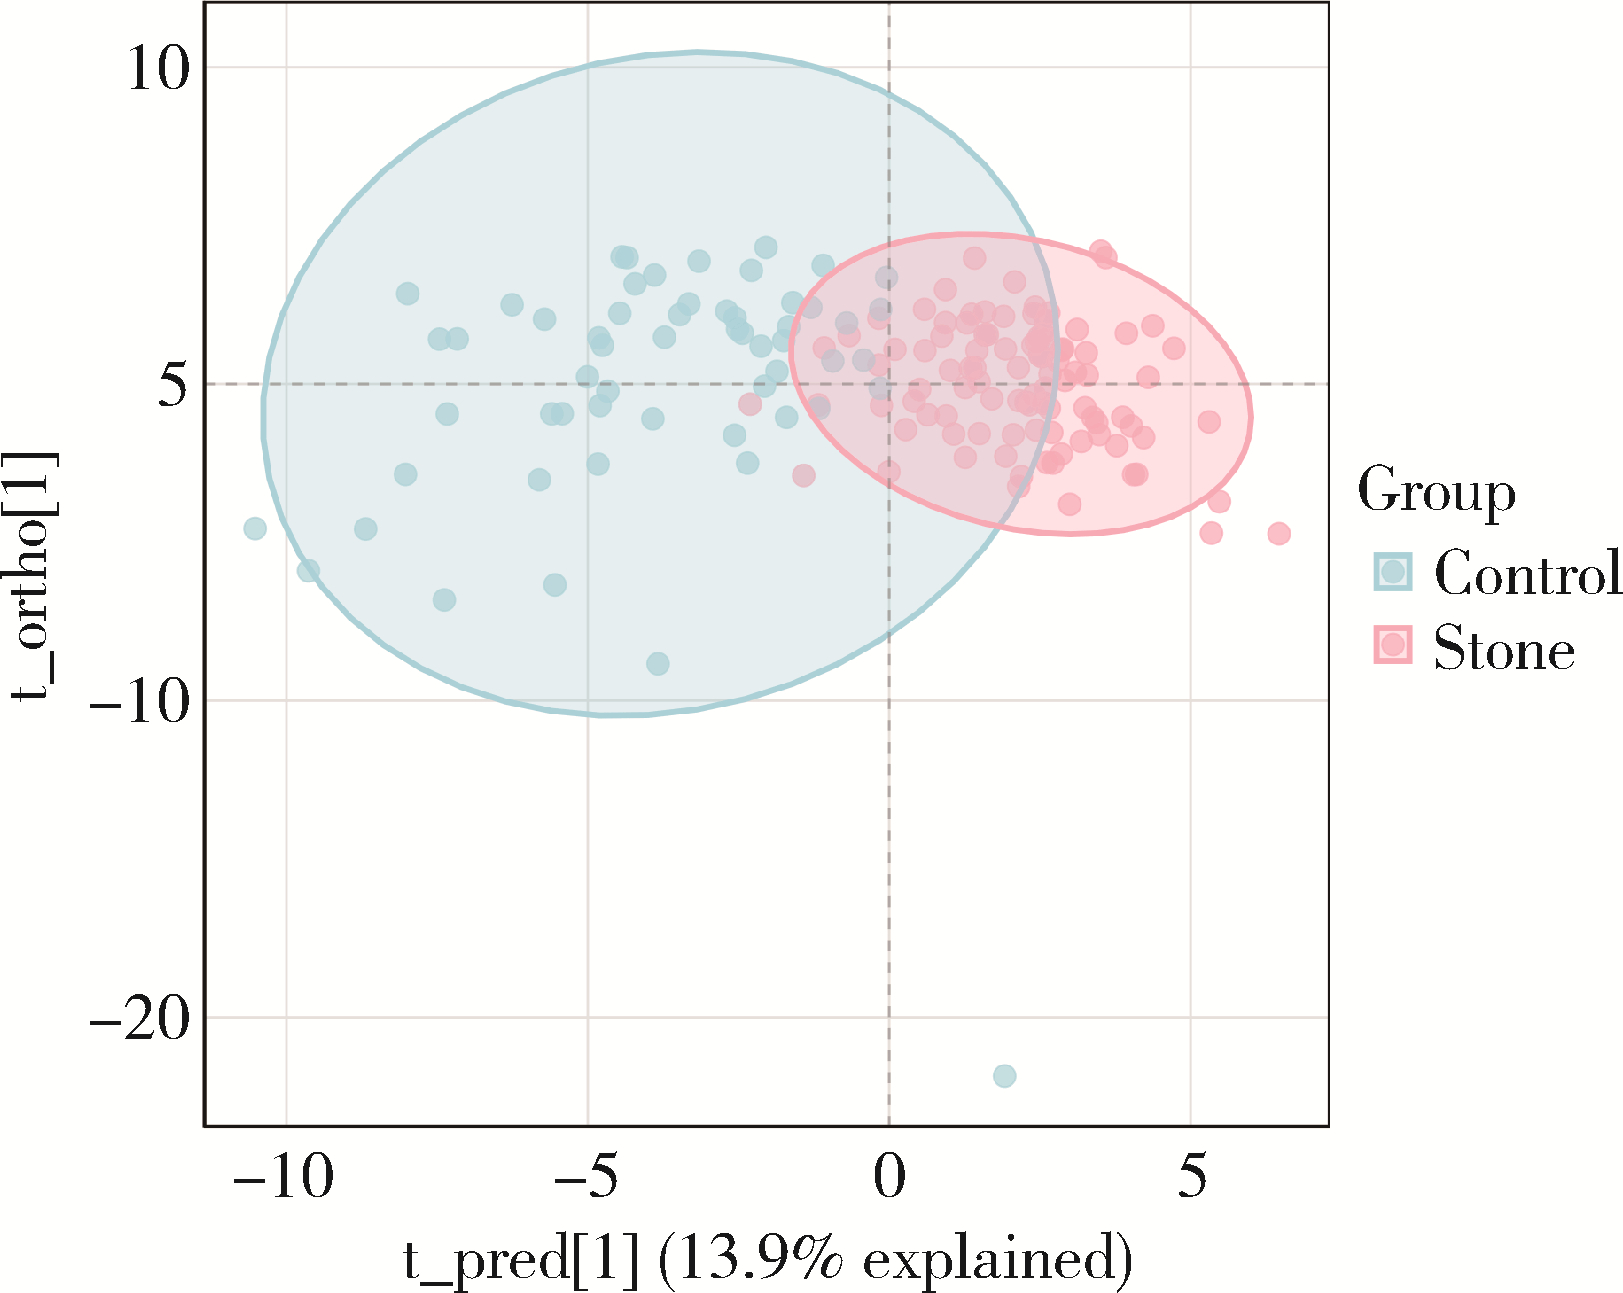
Orthogonal partial least squares discriminant analysis score plot of urinary organic acid profiles in urolithiasis patients and controls The OPLS-DA model clearly demonstrates the distribution of the stone group (red) and control group (blue) along the predictive principal component (t_pred[1], explaining 13.9% of variance) and the orthogonal principal component (t_ortho[1]); A significant separation trend was observed between the two groups along the t_pred[1] axis, with only minor overlap at the edges, indicating substantial differences in urinary organic acid metabolic profiles; The model fit parameters were R2X =0.139, R2Y =0.48, and the predictive ability parameter Q2 =0.457, indicating good explanatory power, predictive stability, and no significant overfitting. OPLS-DA, orthogonal partial least squares discriminant analysis."

Figure 3

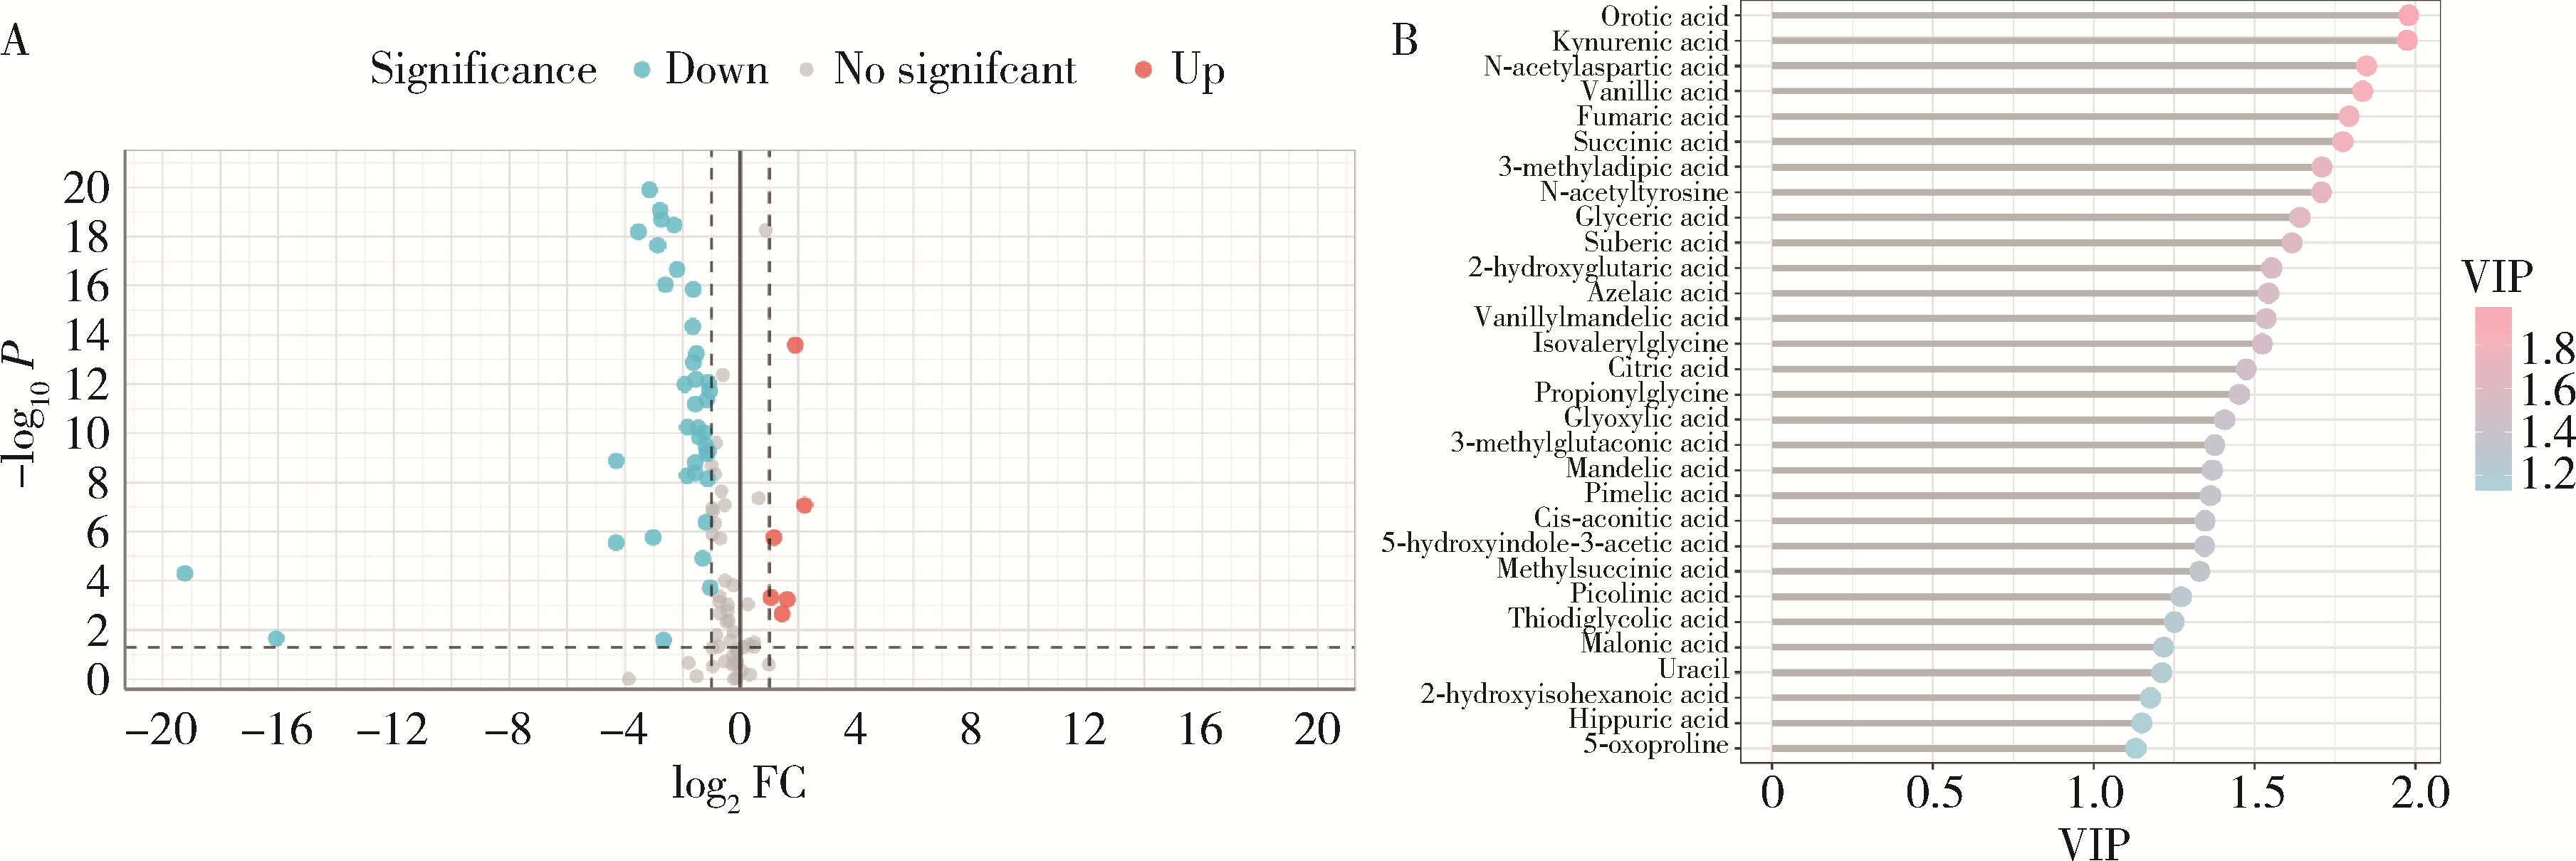
Screening of differentially expressed organic acids and contribution analysis of key metabolites in urolithiasis patients vs. controls A, compared with the control group, a total of 44 organic acids with significant differences were identified in the stone group (P < 0.05), including 6 significantly up-regulated (red) and 38 significantly down-regulated (blue) metabolites; B, the top 30 organic acids with the highest contribution to metabolic separation between groups are shown; The top 10 key metabolites ranked by VIP value are: Orotic acid, kynurenic acid, N-acetylaspartic acid, vanillic acid, fumaric acid, Succinic acid, 3-methyladipic acid, N-acetyltyrosine, glyceric acid, and suberic acid, which are the critical molecules driving the metabolic differences between the two groups. VIP, variable importance in projection; FC, fold change."

Figure 4

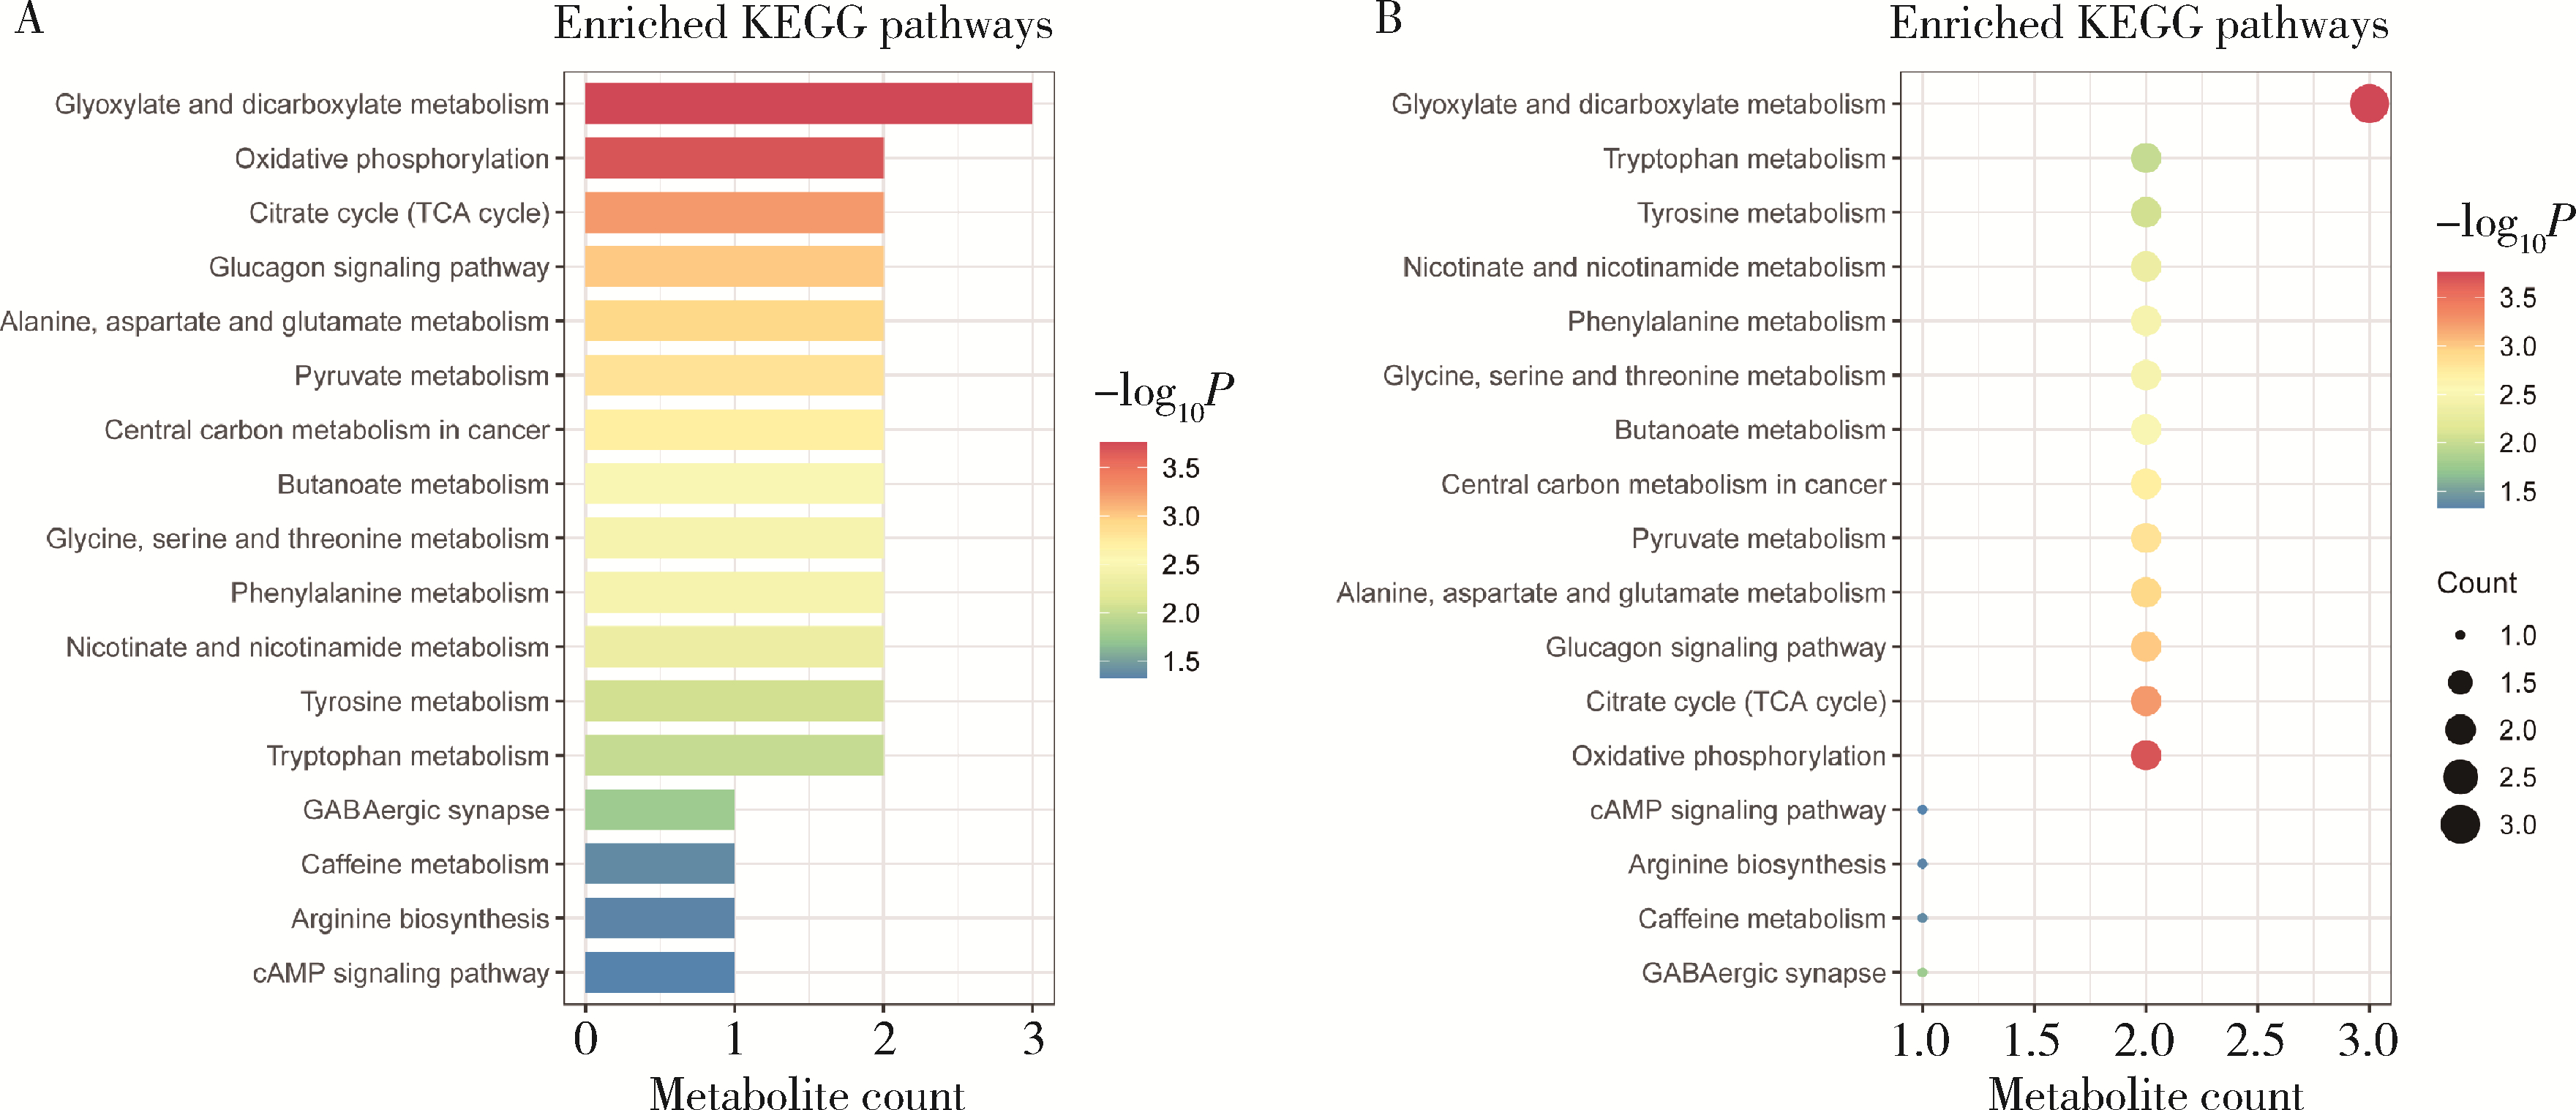
KEGG pathway enrichment analysis of differentially expressed organic acids A, bar chart showing the KEGG pathways significantly enriched by the differentially expressed organic acids, the results show that glyoxylate and dicarboxylate metabolism, oxidative phosphorylation, and the citrate cycle (TCA cycle) are the most significantly enriched pathways, suggesting that the development of urolithiasis is closely related to disturbances in energy metabolism and central carbon metabolism; B, bubble plot further illustrating the characteristics of the enriched pathways, the glyoxylate and dicarboxylate metabolism pathway has the highest number of metabolites and the strongest significance, while oxidative phosphorylation and the citrate cycle also show significant enrichment, further confirming the central role of energy and central carbon metabolism in the pathogenesis of urolithiasis. KEGG, kyoto encyclopedia of genes and genomes; TCA, tricarboxylic acid cycle; GABAergic, gamma-aminobutyric acid-ergic."

Figure 5

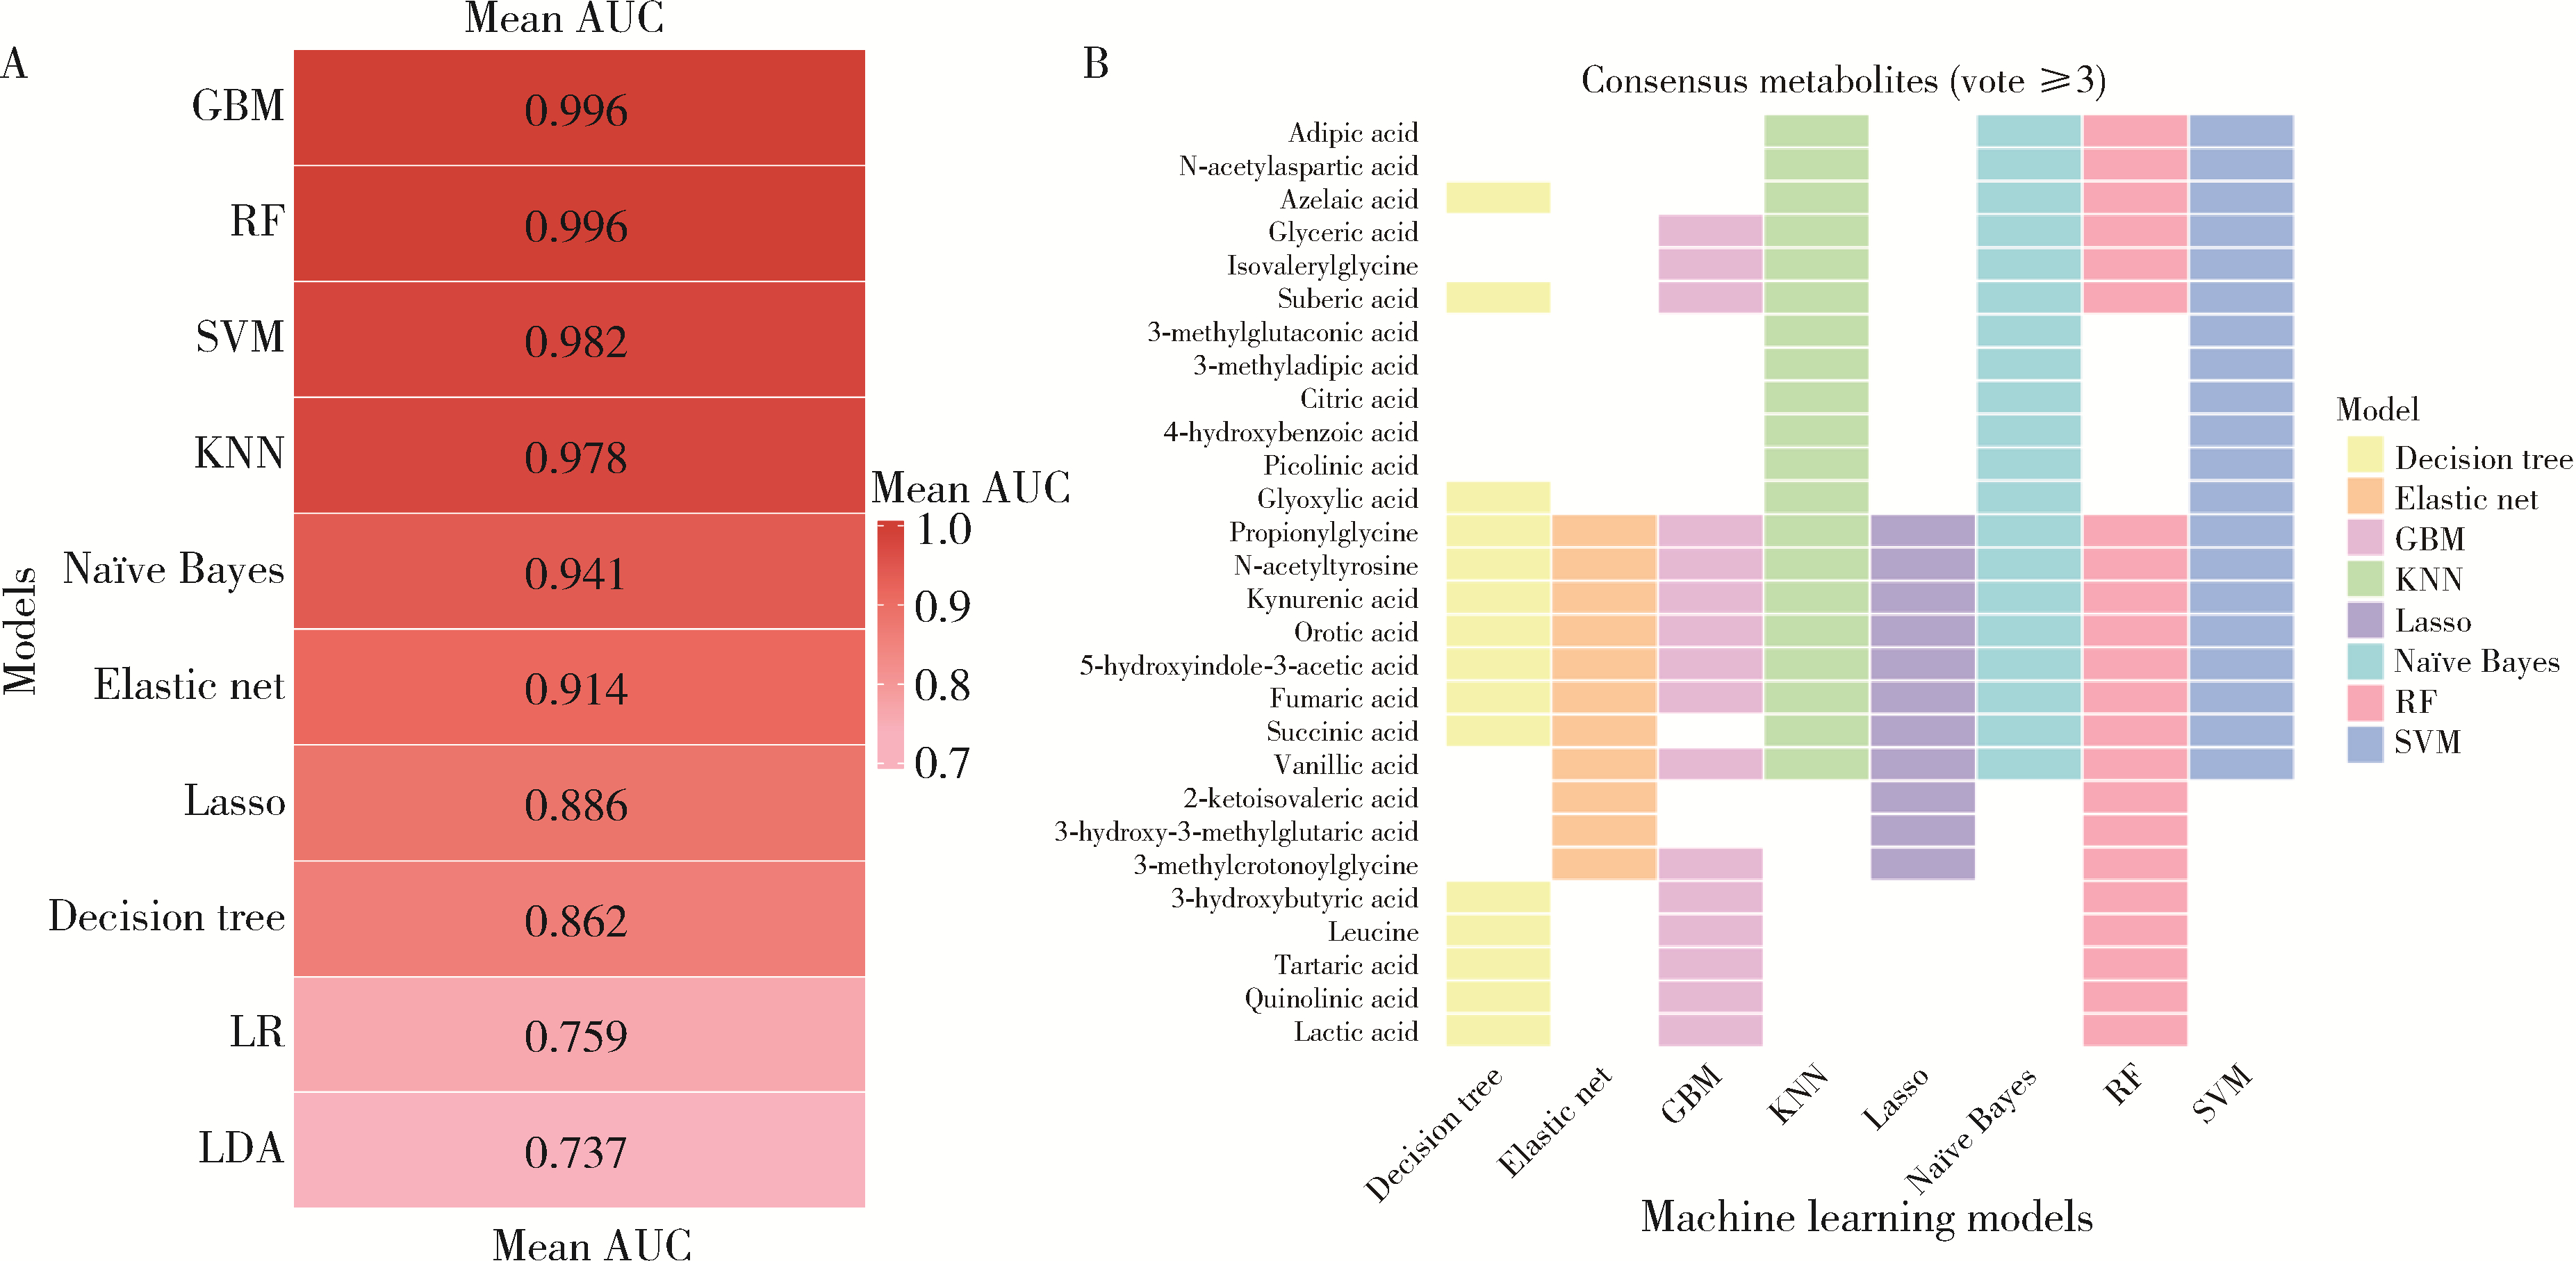
Machine learning analysis of urinary calculi using differential organic acids A, bar chart of mean AUC values for different machine learning models, GBM and RF achieved the highest mean AUC of 0.996, followed by SVM, and KNN, indicating that urinary organic acid metabolites can effectively distinguish stone patients from healthy controls; B, heatmap of consensus metabolites (vote ≥ 3); Key metabolites consistently selected by at least 3 models are shown, including orotic acid, kynurenic acid, succinic acid, and fumaric acid, which serve as core biomarkers for the diagnosis of urolithiasis. VIP, variable importance in projection; FC, fold change; AUC, area under the curve; GBM, gradient boosting machine; RF, fandom forest; SVM, support vector machine; KNN, K-nearest neighbors; LR, Logistic regression; LDA, linear discriminant analysis."

Figure 6

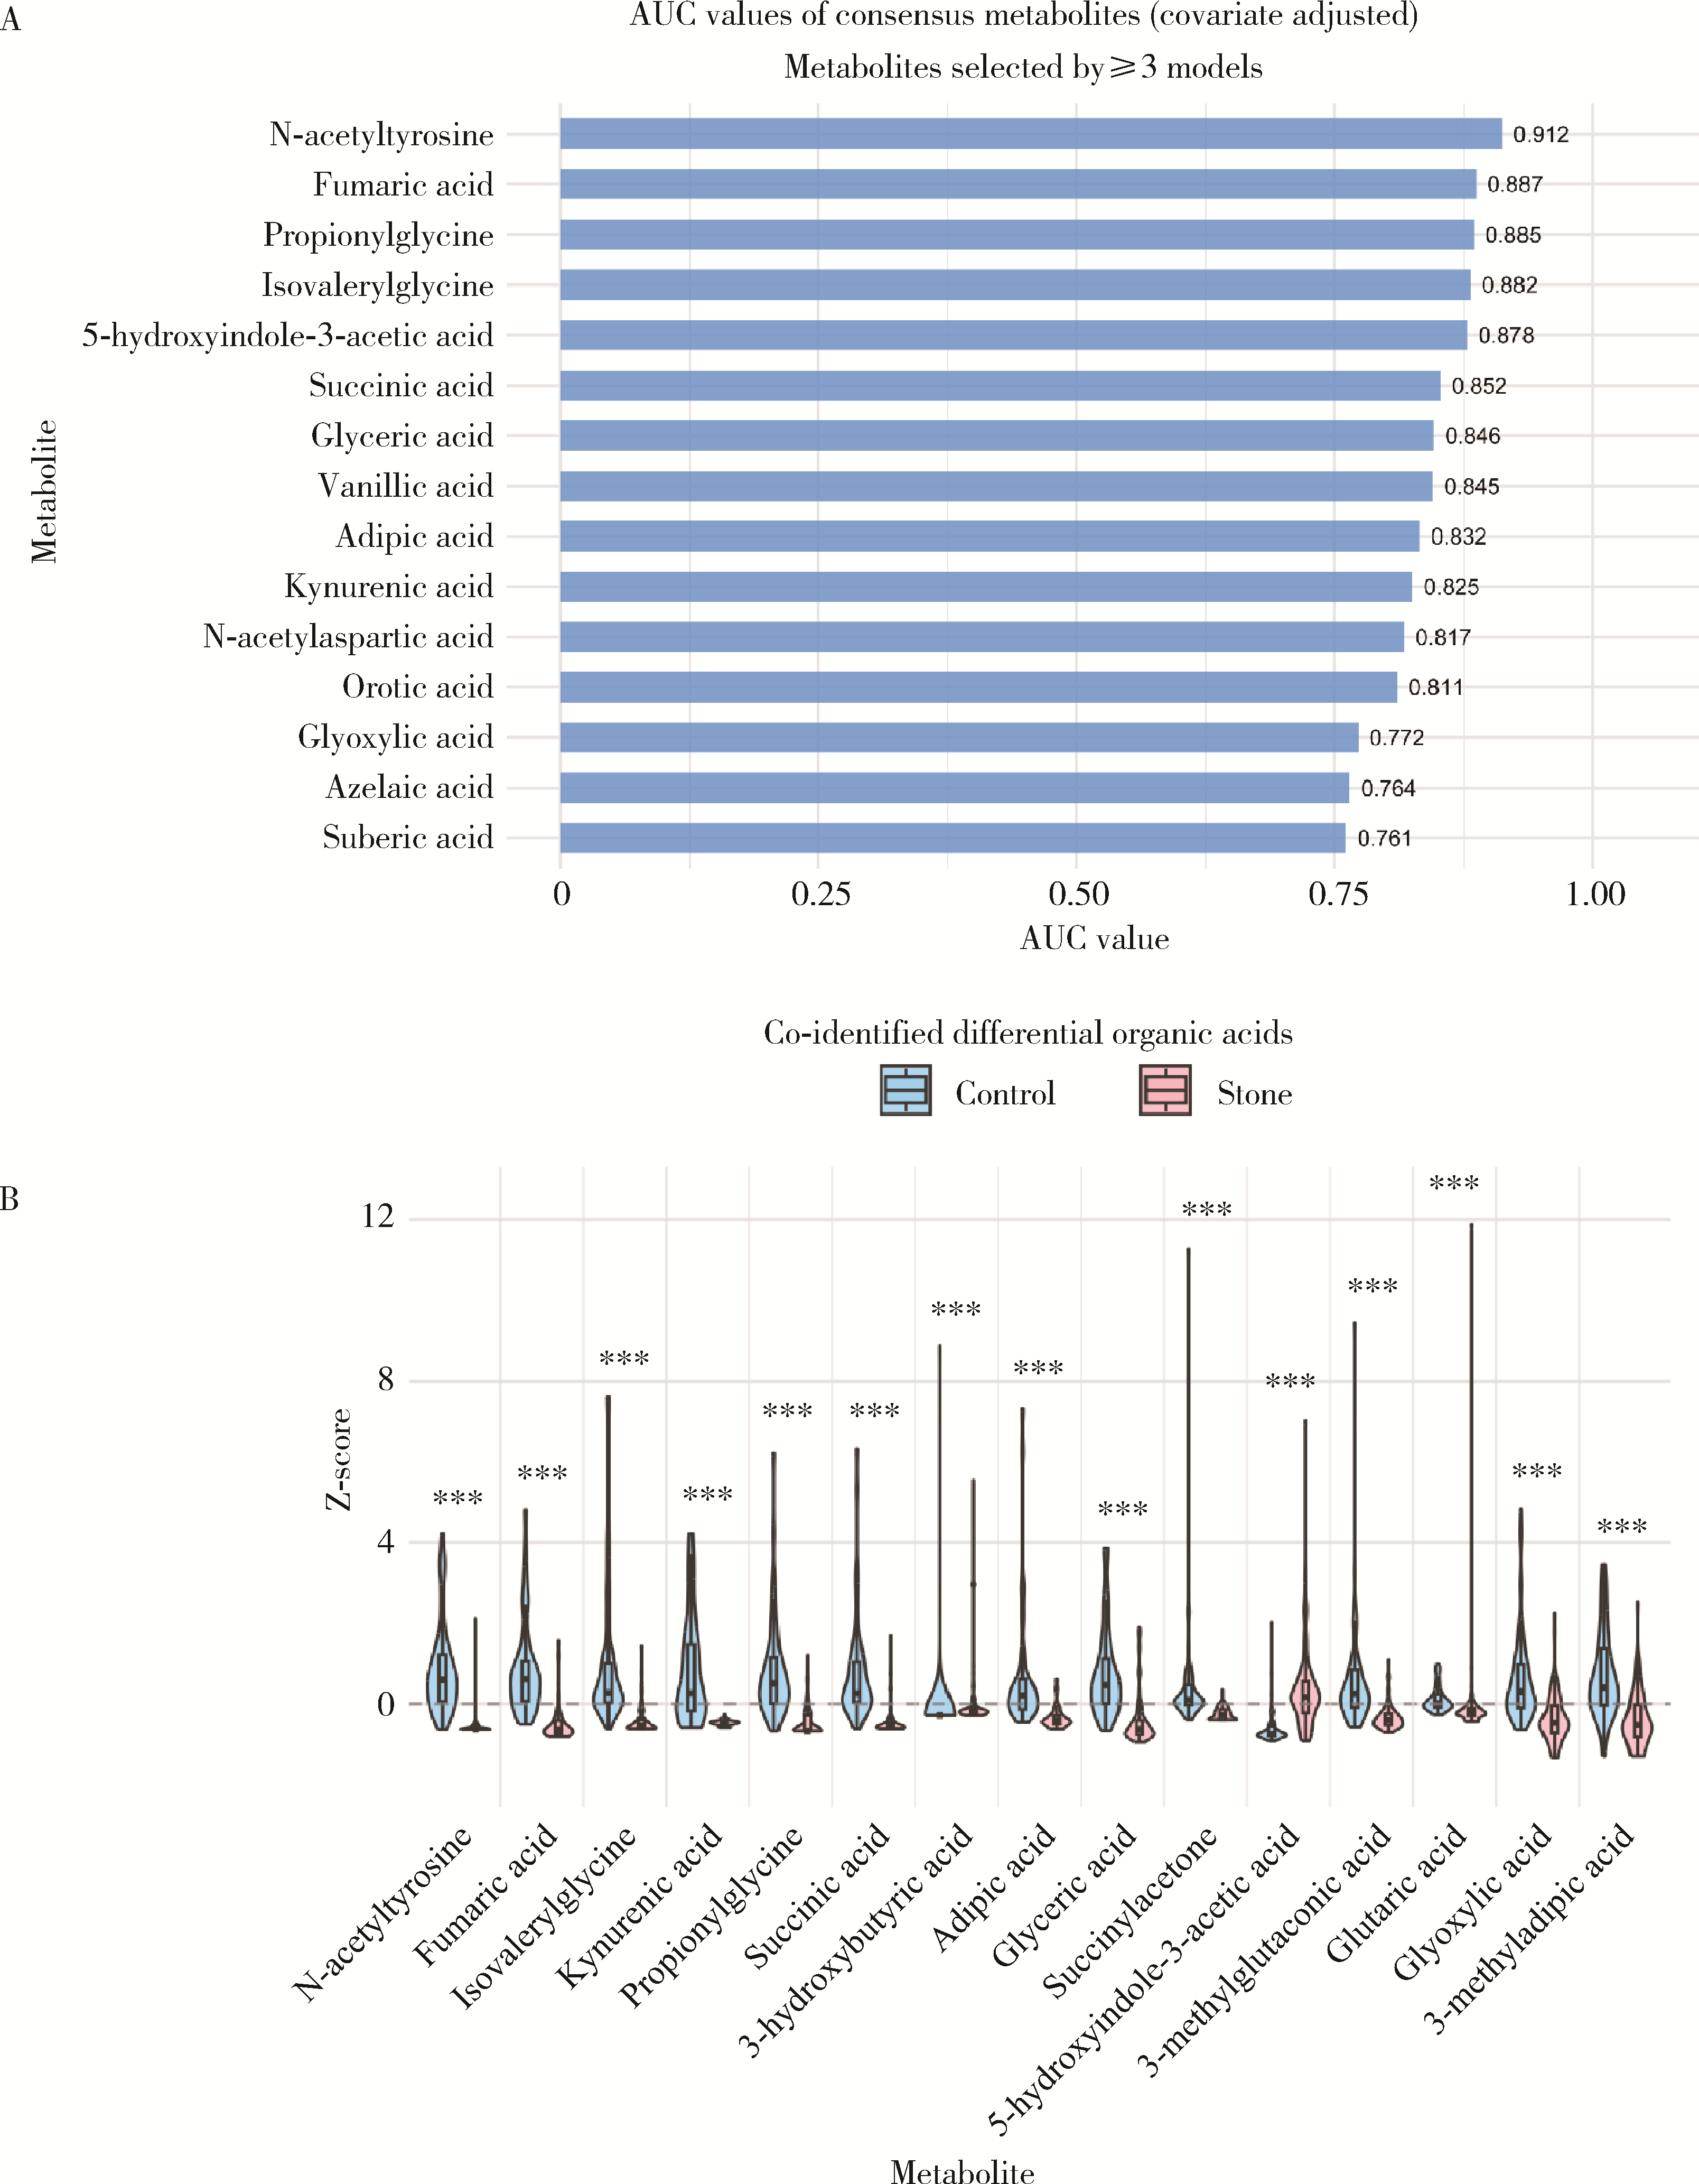
AUC plot and violin plot of consensus urinary organic acids A, bar chart of AUC values for consensus metabolites after covariate adjustment, N-acetyltyrosine achieved the highest AUC value of 0.912, while fumaric acid (0.887) and propionylglycine (0.885) also exhibited high diagnostic efficacy, indicating their potential as independent diagnostic biomarkers for urolithiasis; B, violin plot of co-identified differential organic acids, blue represents the control group, and pink represents the stone group, with Z-score as the normalized expression level, all displayed metabolites showed significant differences between the two groups (P < 0.001), further validating their reliability as diagnostic biomarkers for urolithiasis. * * *P < 0.001. AUC, area under the curve."

Figure 7

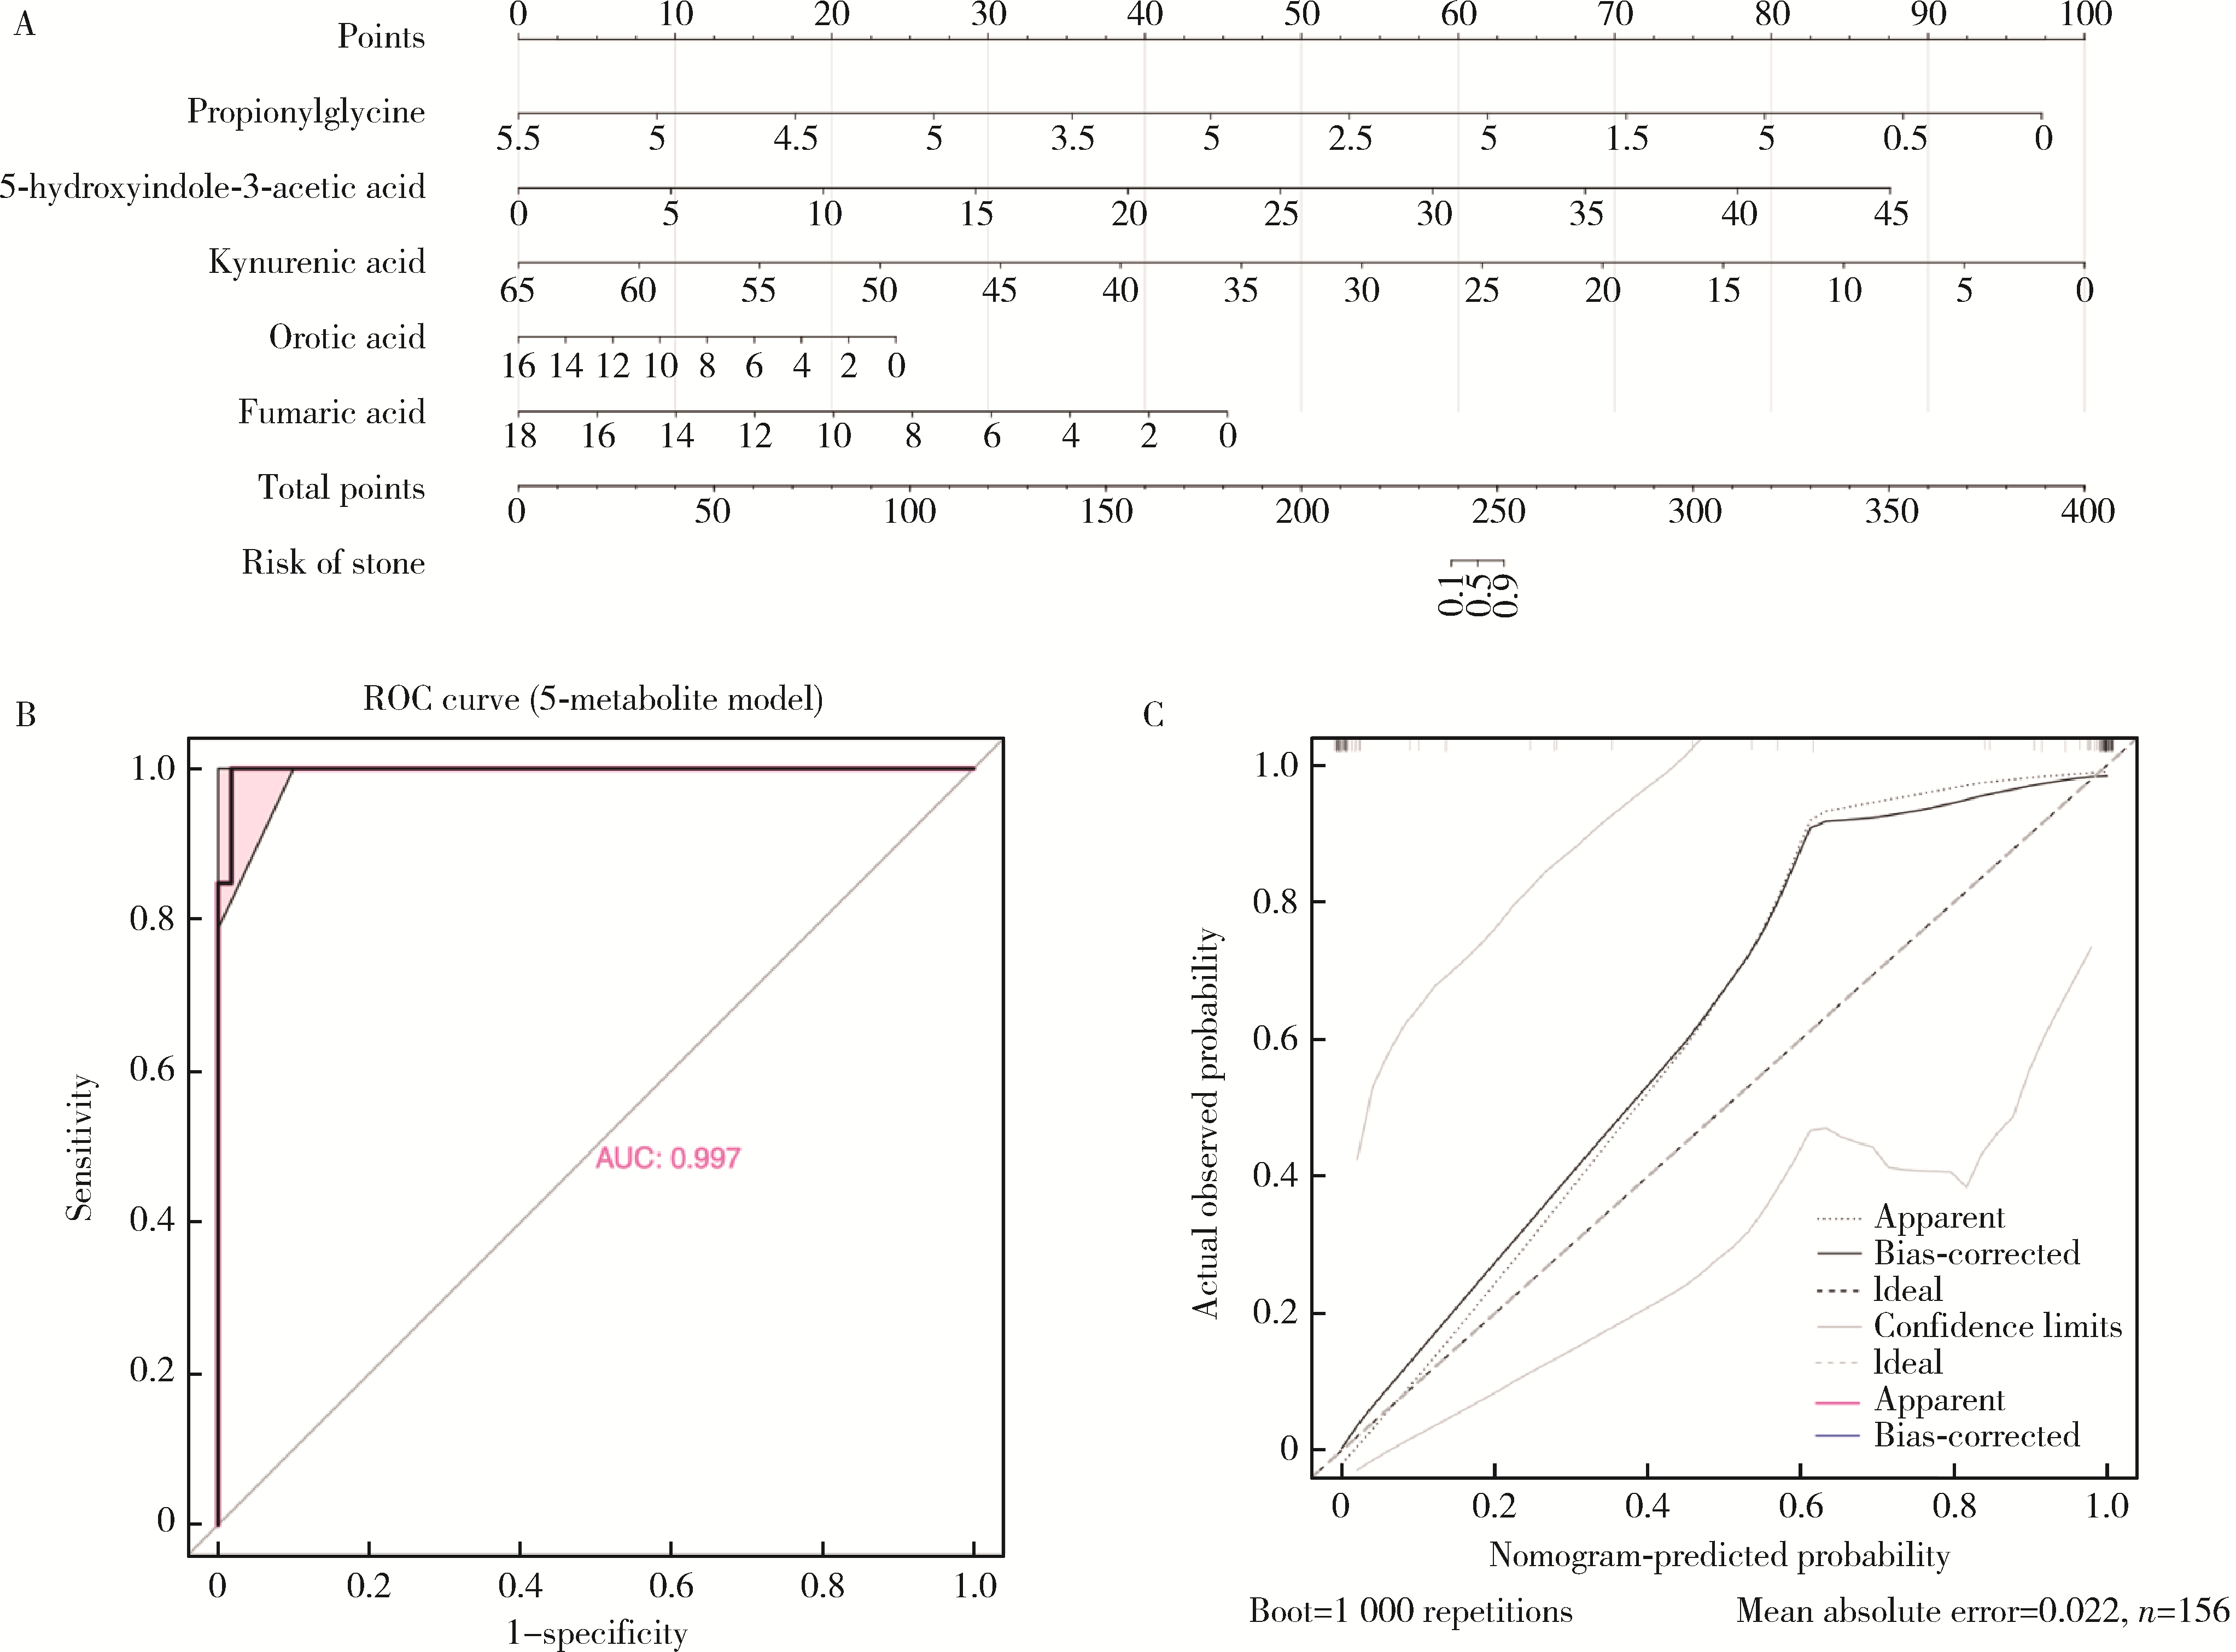
Discrimination efficiency of core metabolite panel for urolithiasis A, metabolite combination panel: Integrates the expression levels of five metabolites, propionylglycine, 5-Hydroxyindole-3-acetic acid, kynurenic acid, orotic acid, and fumaric acid to calculate a total score for reflecting metabolic abnormality associated with urolithiasis; B, ROC curve of the 5-metabolite model, the area under the curve is 0.997, indicating excellent performance in distinguishing patients with urolithiasis from controls; C, calibration curve, the bias-corrected curve closely aligns with the ideal curve, with a mean absolute error of 0.022, demonstrating good calibration and stability of the metabolite combination model. ROC, receiver operating characteristic; AUC, area under the curve."

1
Shoag J , Tasian GE , Goldfarb DS , et al. The new epidemiology of nephrolithiasis[J]. Adv Chronic Kidney Dis, 2015, 22(4): 273- 278.

doi: 10.1053/j.ackd.2015.04.004
2
Ziemba JB , Matlaga BR . Epidemiology and economics of nephrolithiasis[J]. Investig Clin Urol, 2017, 58(5): 299.

doi: 10.4111/icu.2017.58.5.299
3
Sorokin I , Mamoulakis C , Miyazawa K , et al. Epidemiology of stone disease across the world[J]. World J Urol, 2017, 35(9): 1301- 1320.

doi: 10.1007/s00345-017-2008-6
4
Tang X , Lieske JC . Acute and chronic kidney injury in nephrolithiasis[J]. Curr Opin Nephrol Hypertens, 2014, 23(4): 385- 390.

doi: 10.1097/01.mnh.0000447017.28852.52
5
Bargagli M , Scoglio M , Howles SA , et al. Kidney stone disease: Risk factors, pathophysiology and management[J]. Nat Rev Nephrol, 2025, 21(11): 794- 808.

doi: 10.1038/s41581-025-00990-x
6
Kim HN , Kim JH , Chang Y , et al. Gut microbiota and the prevalence and incidence of renal stones[J]. Sci Rep, 2022, 12(1): 3732.

doi: 10.1038/s41598-022-07796-y
7
Lai Y , Zheng H , Sun X , et al. The advances of calcium oxalate calculi associated drugs and targets[J]. Eur J Pharmacol, 2022, 935, 175324.

doi: 10.1016/j.ejphar.2022.175324
8
Peerapen P , Thongboonkerd V . Kidney stone prevention[J]. Adv Nutr, 2023, 14(3): 555- 569.

doi: 10.1016/j.advnut.2023.03.002
9
Zhang XZ , Lei XX , Jiang YL , et al. Application of metabolomics in urolithiasis: The discovery and usage of succinate[J]. Sig Transduct Target Ther, 2023, 8(1): 41.

doi: 10.1038/s41392-023-01311-z
10
Duan X , Zhang T , Ou L , et al. 1H NMR-based metabolomic study of metabolic profiling for the urine of kidney stone patients[J]. Urolithiasis, 2020, 48(1): 27- 35.

doi: 10.1007/s00240-019-01132-2
11
Kaneko K , Kobayashi R , Yasuda M , et al. Comparison of matrix proteins in different types of urinary stone by proteomic analysis using liquid chromatography-tandem mass spectrometry[J]. Int J Urol, 2012, 19(8): 765- 772.

doi: 10.1111/j.1442-2042.2012.03005.x
12
Boonla C , Tosukhowong P , Spittau B , et al. Inflammatory and fibrotic proteins proteomically identified as key protein constituents in urine and stone matrix of patients with kidney calculi[J]. Clin Chim Acta, 2014, 429, 81- 89.

doi: 10.1016/j.cca.2013.11.036
13
Wang Z , Zhang Y , Zhang J , et al. Recent advances on the mechanisms of kidney stone formation (Review)[J]. Int J Mol Med, 2021, 48(2): 149.

doi: 10.3892/ijmm.2021.4982
14
Bolanos-Palmieri P , Schenk H , Bähre H , et al. Kynurenine pathway dysregulation impairs podocyte morphology and bioenergetics in vitro and leads to glomerular dysfunction[J]. FASEB J, 2025, 39(22): e71228.

doi: 10.1096/fj.202502175R
15
Liu JR , Miao H , Deng DQ , et al. Gut microbiota-derived tryptophan metabolism mediates renal fibrosis by aryl hydrocarbon receptor signaling activation[J]. Cell Mol Life Sci, 2021, 78(3): 909- 922.

doi: 10.1007/s00018-020-03645-1
16
Agudelo LZ , Ferreira DMS , Cervenka I , et al. Kynurenic acid and Gpr35 regulate adipose tissue energy homeostasis and inflammation[J]. Cell Metab, 2018, 27(2): 378- 392. e5.

doi: 10.1016/j.cmet.2018.01.004
17
Zakrocka I , Załuska W . Kynurenine pathway in kidney diseases[J]. Pharmacol Rep, 2022, 74(1): 27- 39.

doi: 10.1007/s43440-021-00329-w
18
Sadaf H , Raza SI , Hassan SW . Role of gut microbiota against calcium oxalate[J]. Microb Pathog, 2017, 109, 287- 291.

doi: 10.1016/j.micpath.2017.06.009
19
Song Q , Song C , Chen X , et al. Oxalate regulates crystal-cell adhesion and macrophage metabolism via JPT2/PI3K/AKT signaling to promote the progression of kidney stones[J]. J Pharm Anal, 2024, 14(6): 100956.

doi: 10.1016/j.jpha.2024.02.010
20
Tavasoli S , Alebouyeh M , Naji M , et al. Association of intestinal oxalate-degrading bacteria with recurrent calcium kidney stone formation and hyperoxaluria: A case-control study[J]. BJU Int, 2020, 125(1): 133- 143.

doi: 10.1111/bju.14840
21
Cao C , Li F , Ding Q , et al. Potassium sodium hydrogen citrate intervention on gut microbiota and clinical features in uric acid stone patients[J]. Appl Microbiol Biotechnol, 2024, 108(1): 51.

doi: 10.1007/s00253-023-12953-y
22
Gao H , Lin J , Xiong F , et al. Urinary microbial and metabolomic profiles in kidney stone disease[J]. Front Cell Infect Microbiol, 2022, 12, 953392.

doi: 10.3389/fcimb.2022.953392
[1] Zhao XIANG, Li YANG, Jing YANG. Untargeted metabolomics reveals differential serum metabolites and metabolic pathways in patients with primary Sjögren syndrome and thrombocytopenia [J]. Journal of Peking University (Health Sciences), 2025, 57(6): 1042-1050.
[2] Jinghui JI, Xiushi LIN, Dameng PAN, Zhiying WU, Zixuan XUE, Xiaojun TIAN, Shudong ZHANG, Binshuai WANG, Min QIU. Efficacy of rigid ureteroscopic laser lithotripsy combined with N-trap in the treatment of ureteral stones with a maximum diameter equal to or greater than 1.5 cm [J]. Journal of Peking University (Health Sciences), 2025, 57(4): 676-683.
[3] Xue-ping WANG,Yu-ya-nan ZHANG,Tian-lan LU,Zhe LU,Zhe-wei KANG,Yao-yao SUN,Wei-hua YUE. Variations in fecal microbiota of first episode schizophrenia associated with clinical assessment and serum metabolomics [J]. Journal of Peking University (Health Sciences), 2022, 54(5): 863-873.
[4] Yuan MA,Yue ZHANG,Rui LI,Shu-wei DENG,Qiu-shi QIN,Liu-luan ZHU. Characteristics of amino acid metabolism in myeloid-derived suppressor cells in septic mice [J]. Journal of Peking University (Health Sciences), 2022, 54(3): 532-540.
[5] Shuo HAN,Zhang-jian CHEN,Di ZHOU,Pai ZHENG,Jia-he ZHANG,Guang JIA. Effects of titanium dioxide nanoparticles on fecal metabolome in rats after oral administration for 90 days [J]. Journal of Peking University (Health Sciences), 2020, 52(3): 457-463.
[6] LIU Yu-qing, LU Jian, HAO Yi-chang, XIAO Chun-lei, MA Lu-lin. Predicting model based on risk factors for urosepsis after percutaneous nephrolithotomy [J]. Journal of Peking University(Health Sciences), 2018, 50(3): 507-513.
[7] YU Lu-ping, XU Tao. Analysis of development, safety and efficacy of percutaneous nephrolithotomy for management of upper urinary tract calculi in pediatric patients [J]. Journal of Peking University(Health Sciences), 2017, 49(4): 626-631.
Viewed
Full text


Abstract

Cited

  Shared   
  Discussed   
No Suggested Reading articles found!