北京大学学报(医学版) ›› 2023, Vol. 55 ›› Issue (3): 442-449. doi: 10.19723/j.issn.1671-167X.2023.03.009

• 论著 • 上一篇    下一篇

应激性血糖升高对重症监护病房患者28 d全因死亡风险的预测价值

汪雨欣,邓宇含,谭银亮,刘宝花*()   

  1. 北京大学公共卫生学院社会医学与健康教育系,北京 100191
  • 收稿日期:2022-12-02 出版日期:2023-06-18 发布日期:2023-06-12
  • 通讯作者: 刘宝花 E-mail:baohualiu@bjmu.edu.cn
  • 基金资助:
    国家重点研发计划(2018YFC1311700);国家重点研发计划(2018YFC1311703)

Predictive value of stress-induced hyperglycemia on 28 d risk of all-cause death in intensive care patients

Yu-xin WANG,Yu-han DENG,Yin-liang TAN,Bao-hua LIU*()   

  1. Department of Social Medicine and Health Education, Peking University School of Public Health, Beijing 100191, China
  • Received:2022-12-02 Online:2023-06-18 Published:2023-06-12
  • Contact: Bao-hua LIU E-mail:baohualiu@bjmu.edu.cn
  • Supported by:
    the National Key Development and Program of China(2018YFC1311700);the National Key Development and Program of China(2018YFC1311703)

摘要:

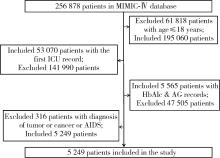
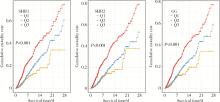
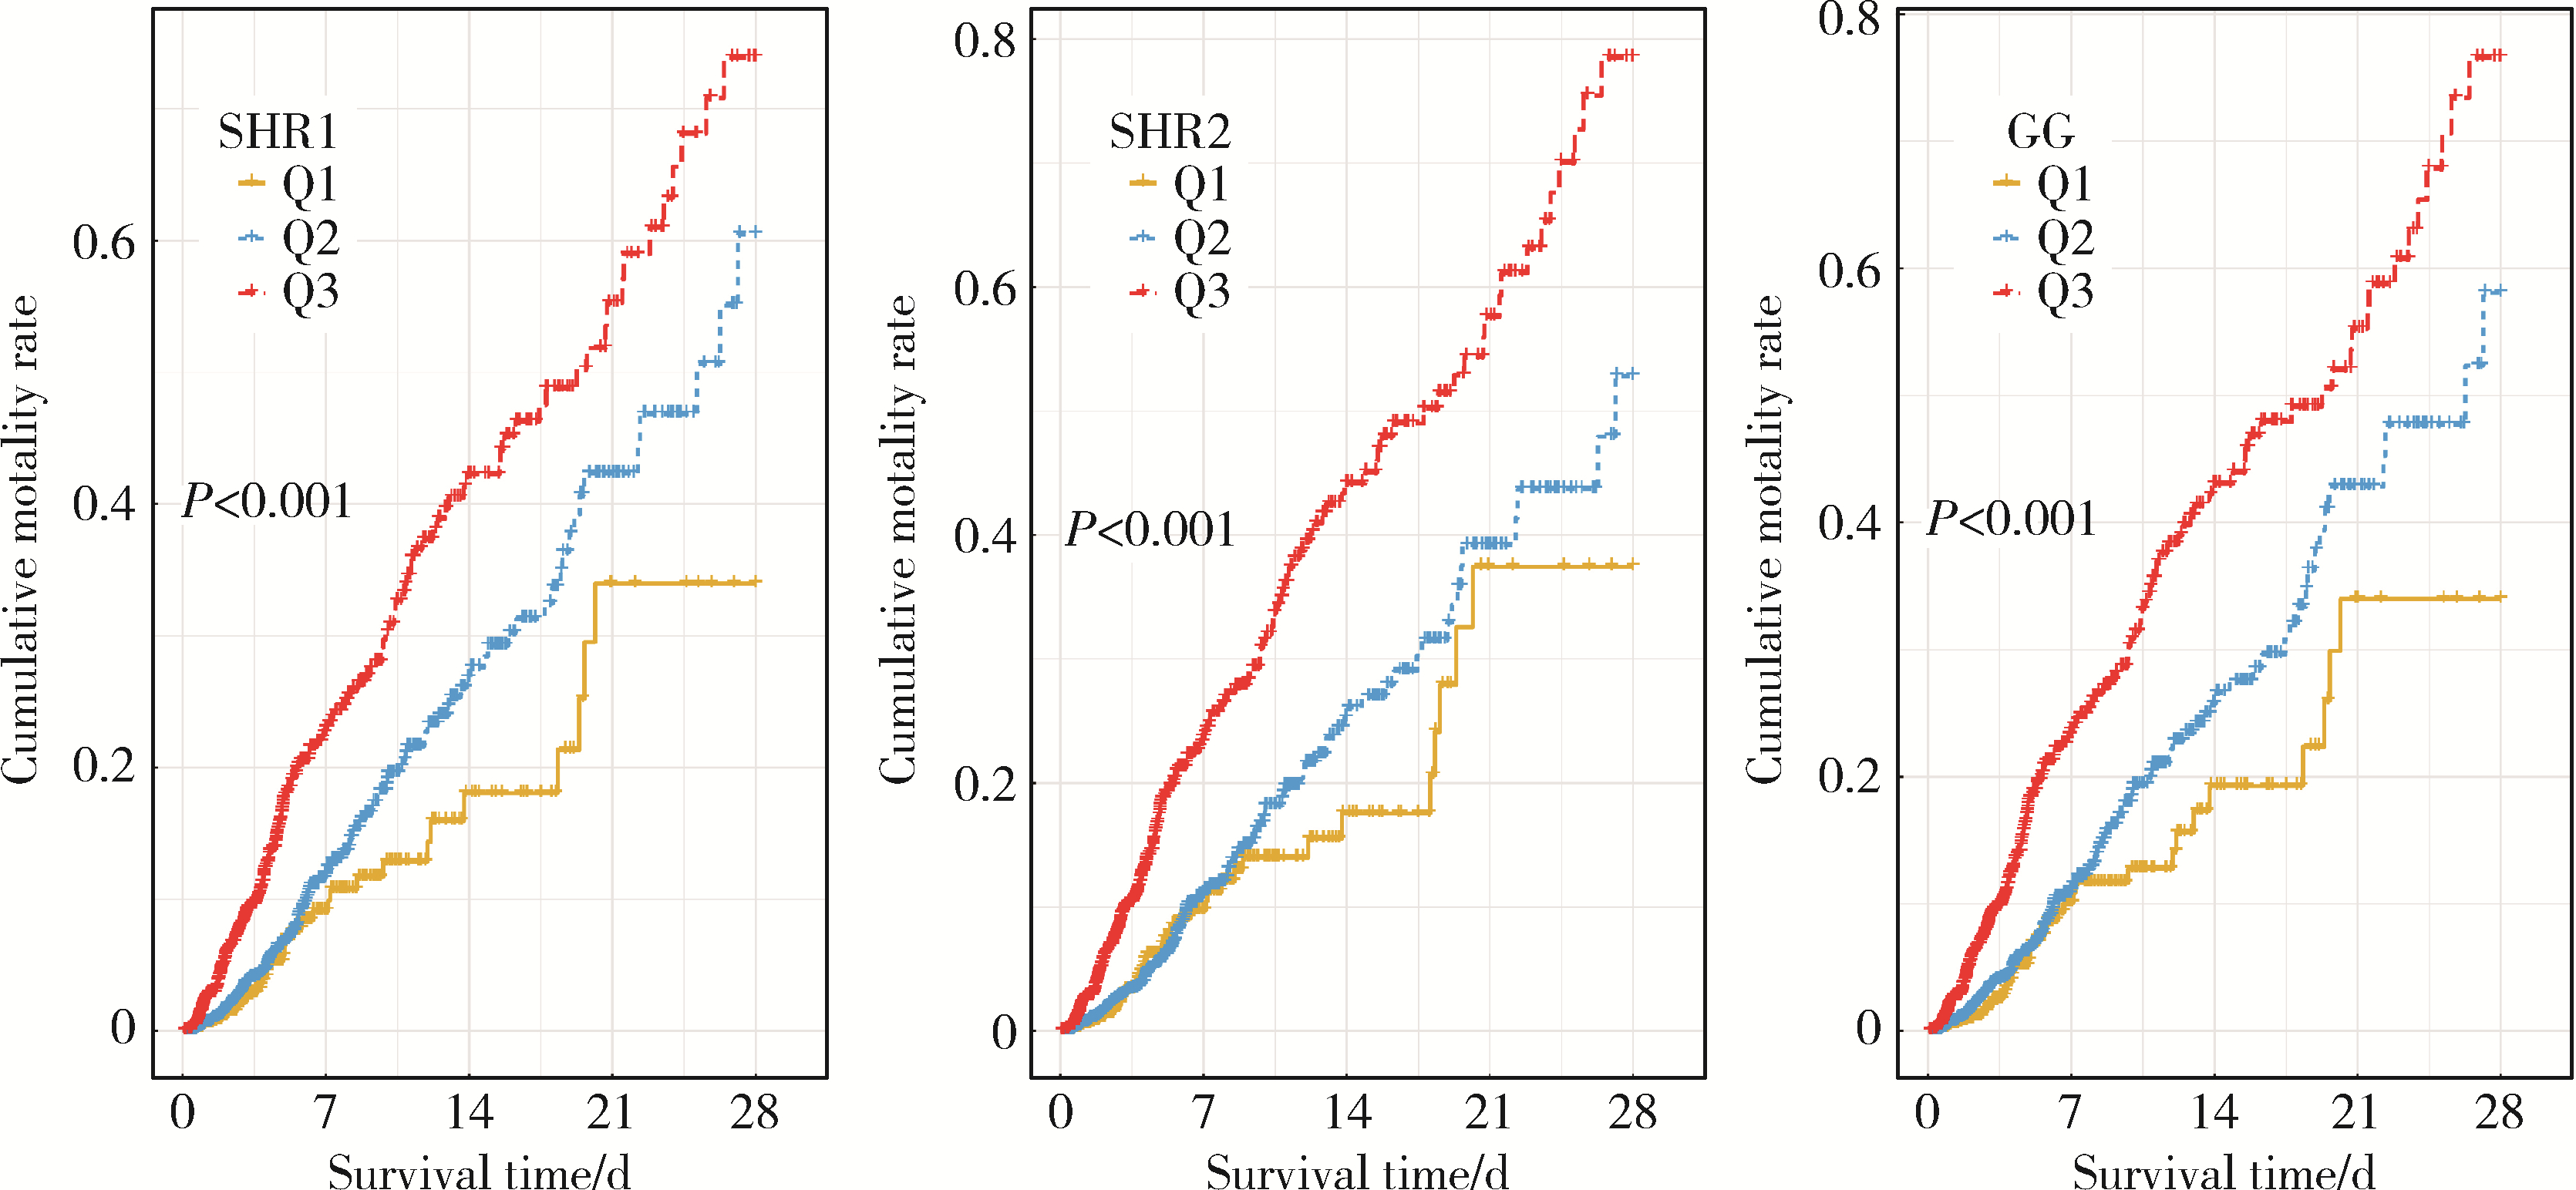
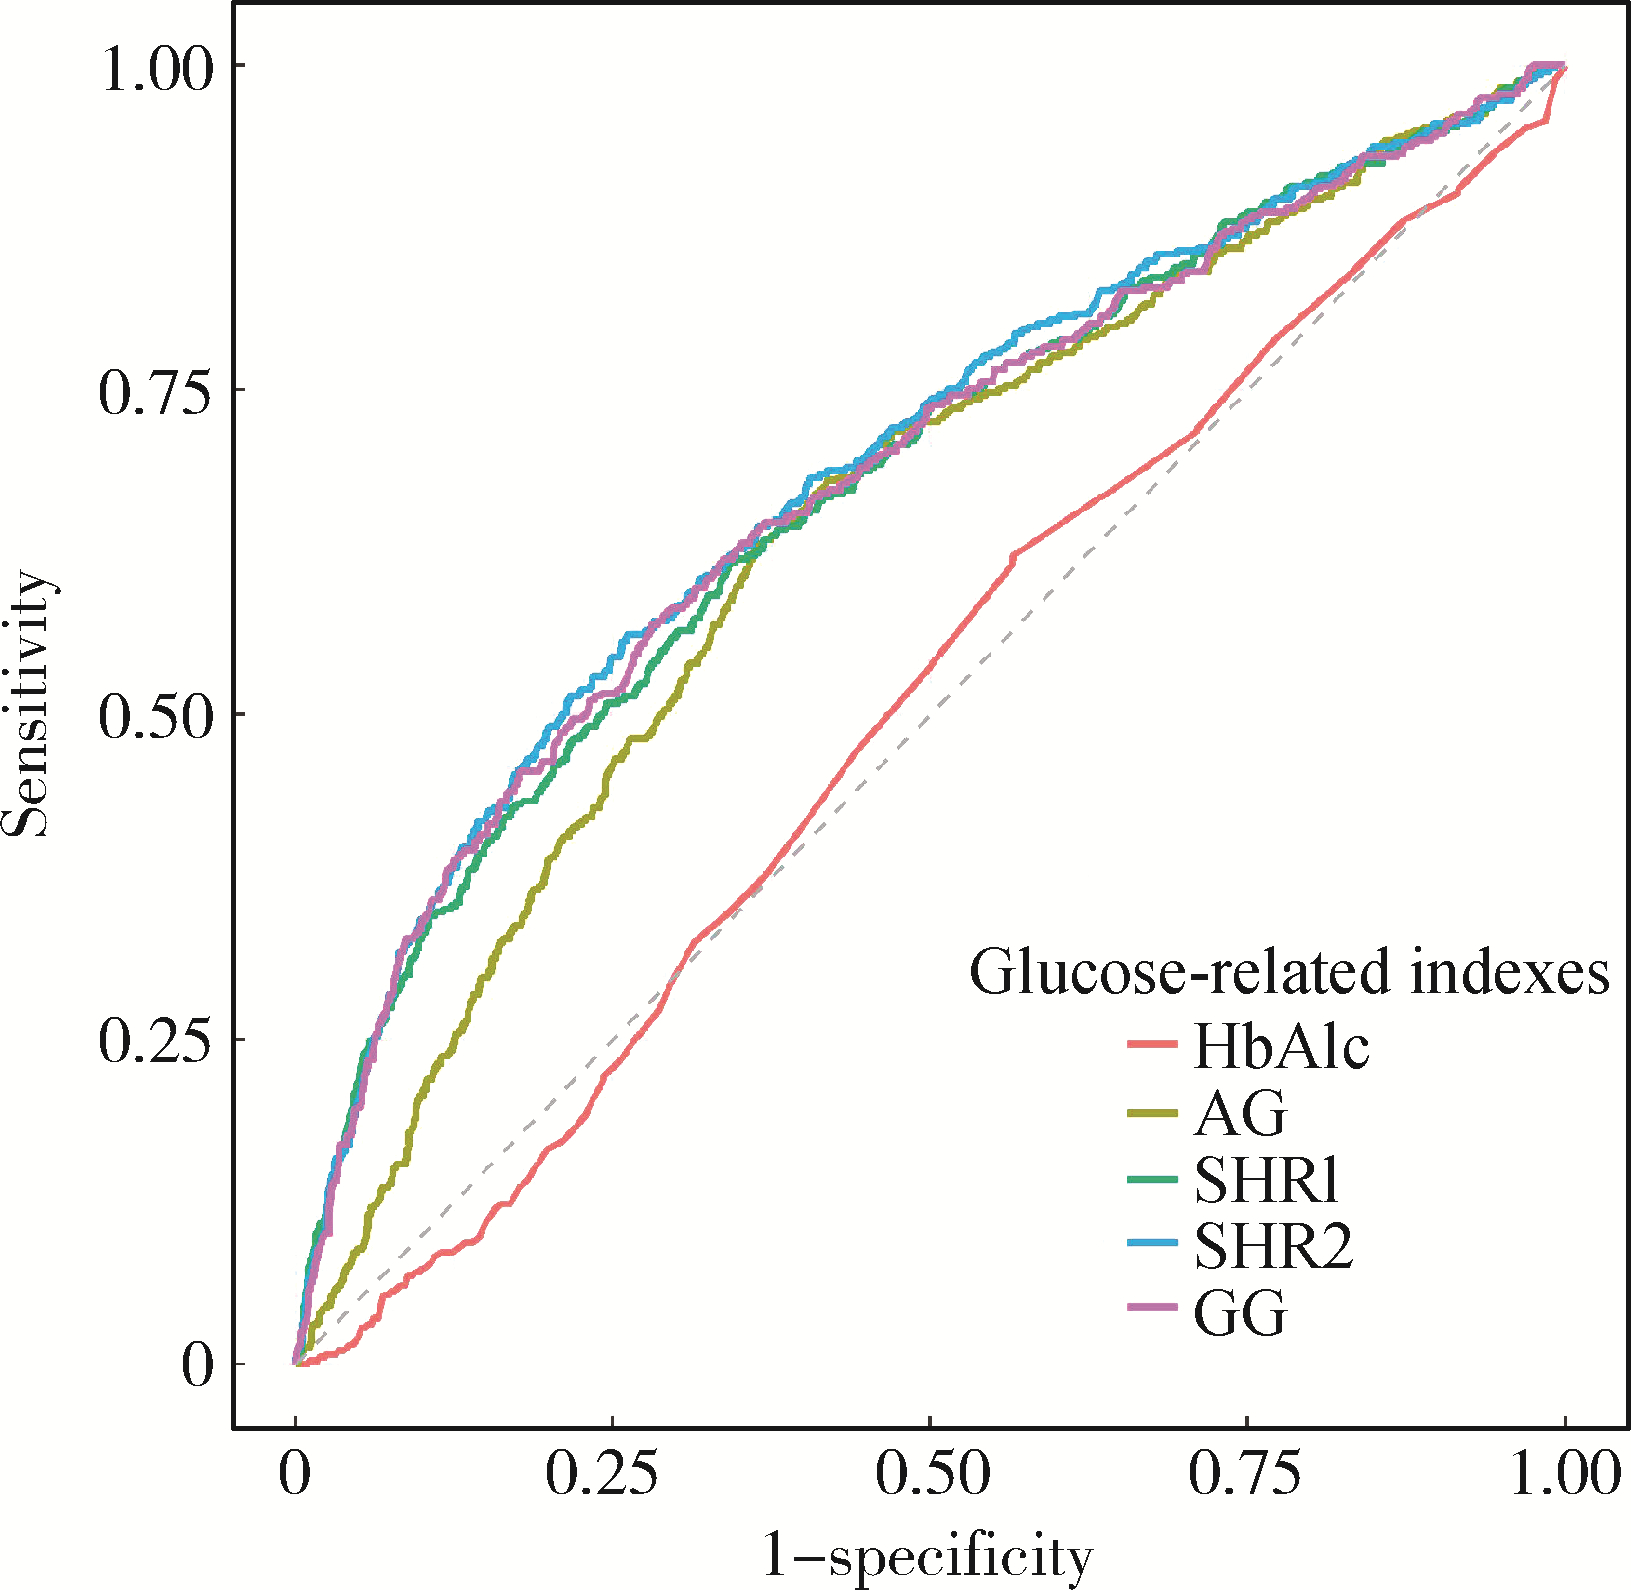
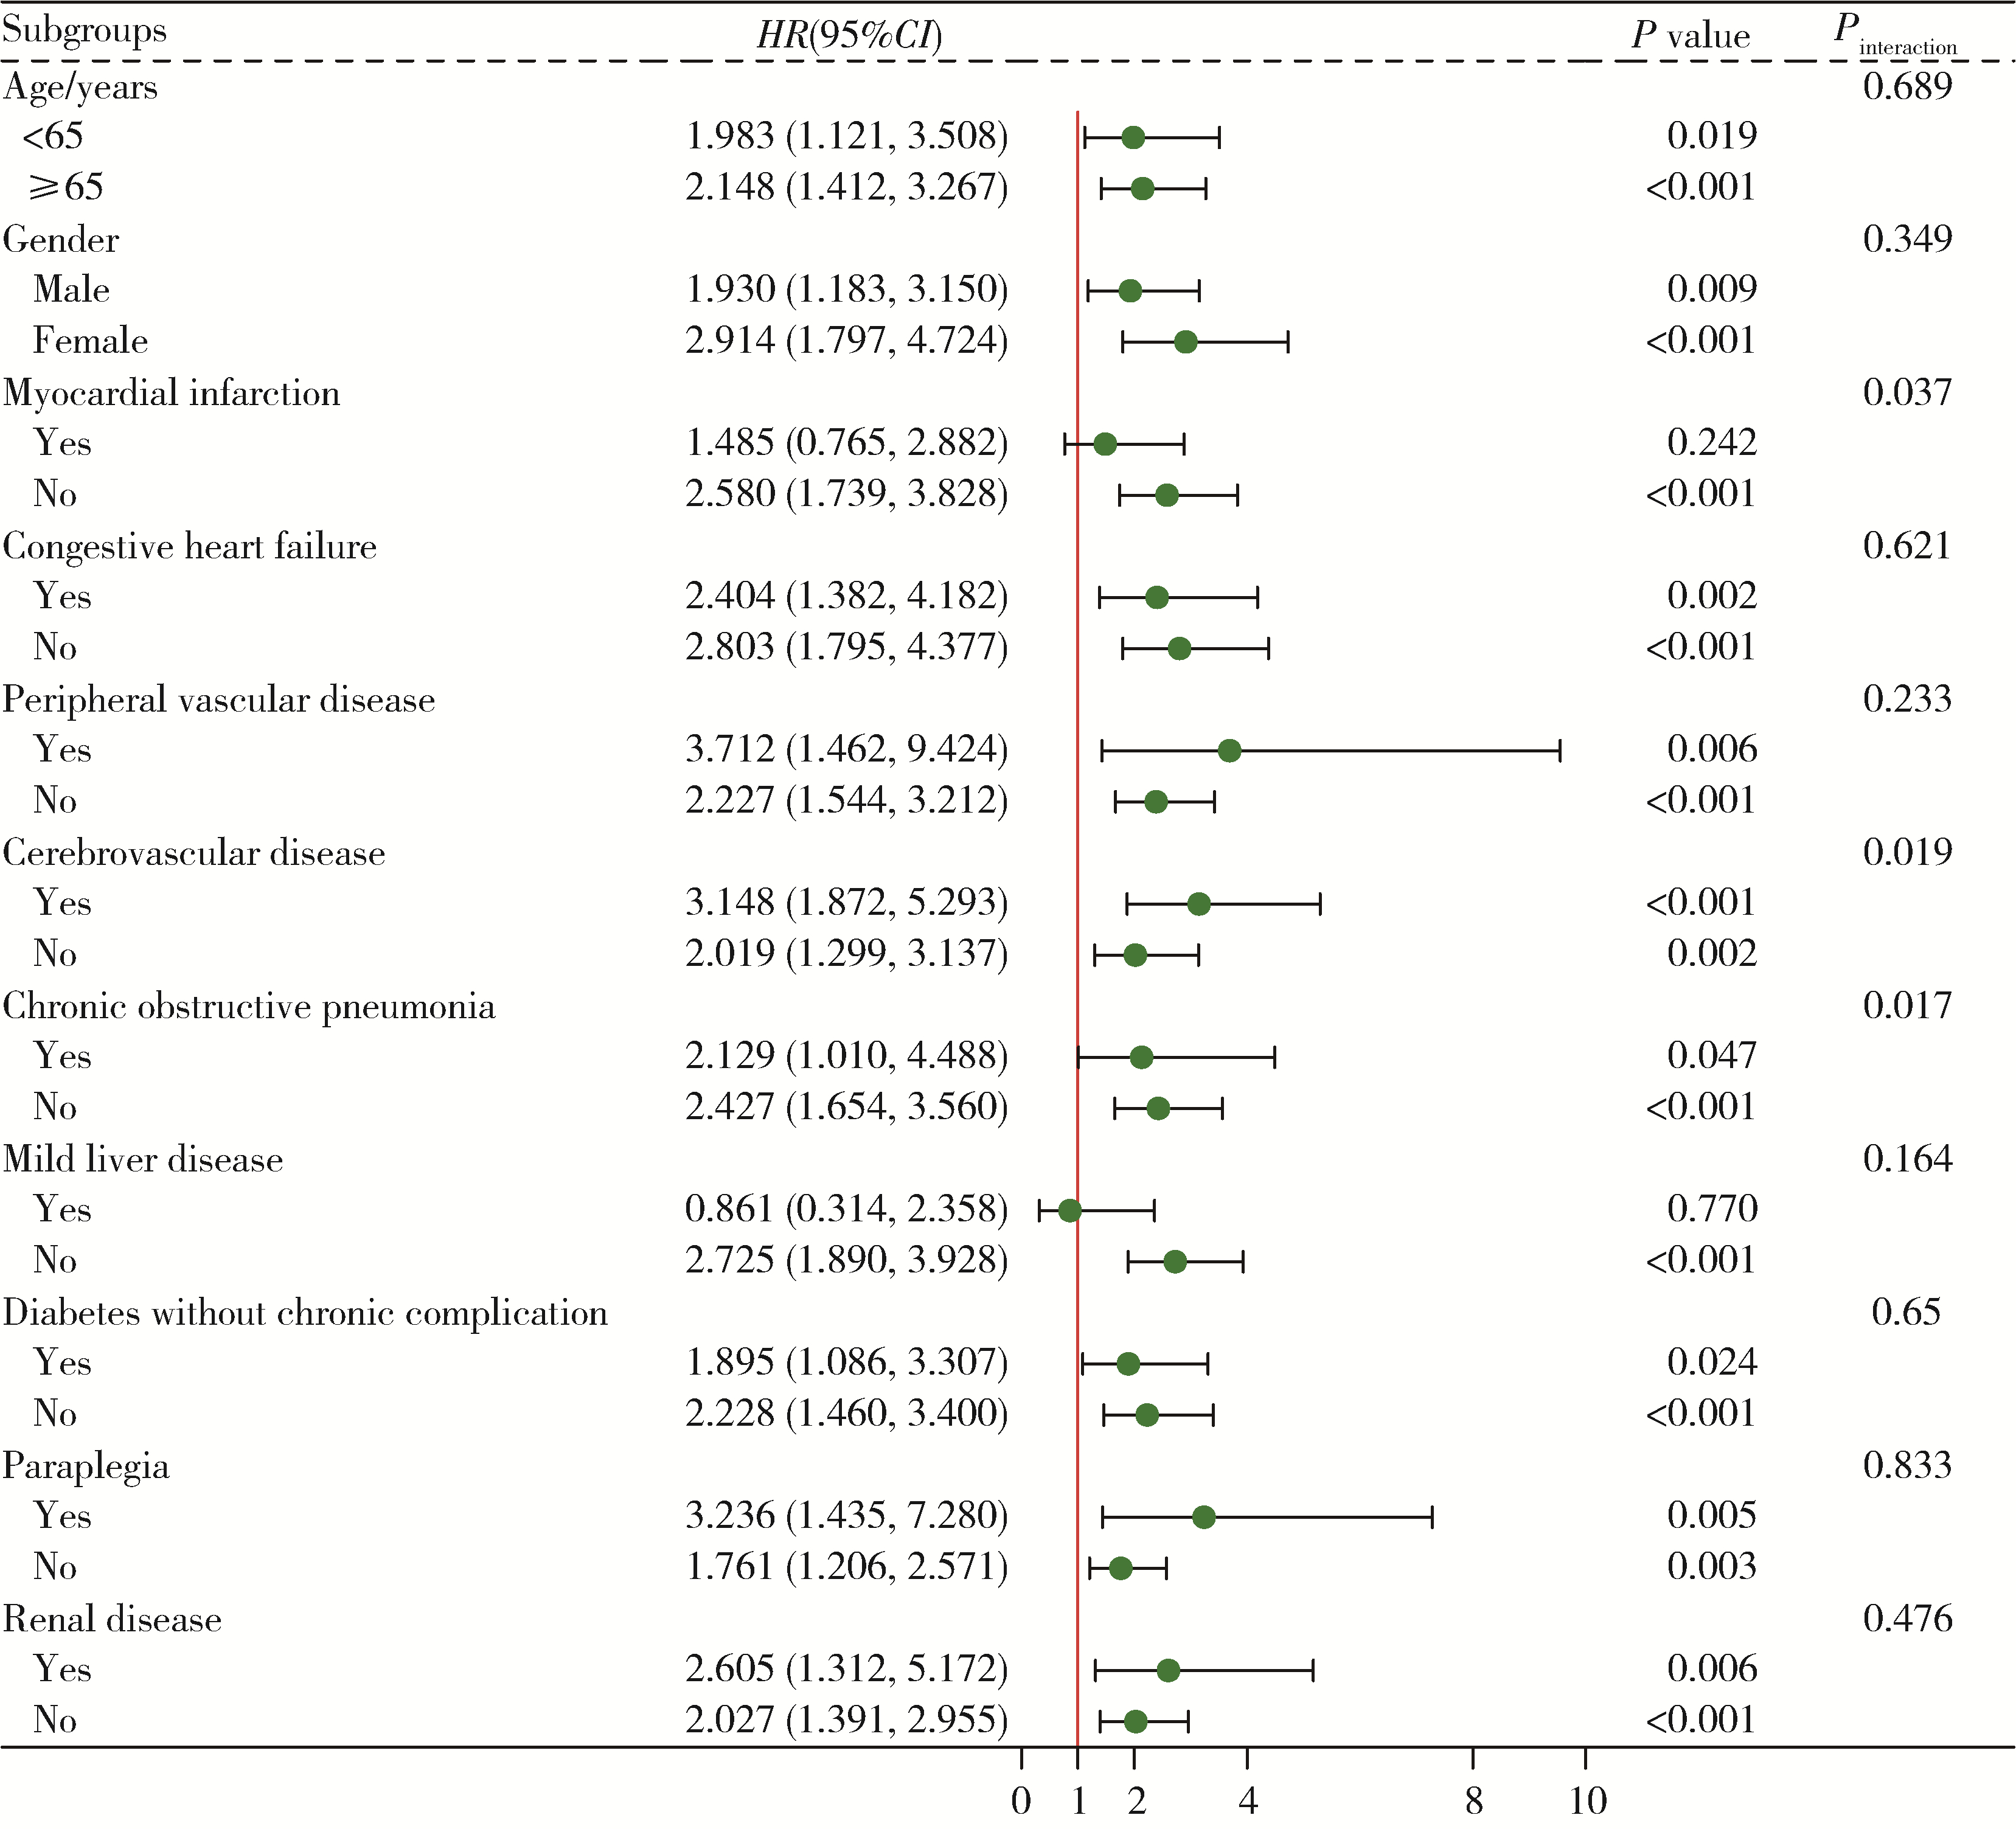
目的: 探究应激性血糖升高与重症监护病房(intensive care unit, ICU) 患者28 d全因死亡风险之间的关系, 并比较不同应激性血糖升高指标的预测效能。方法: 以重症医学(Medical Information Mart for Intensive Care Ⅳ, MIMIC-Ⅳ) 数据库中符合纳入、排除标准的ICU患者为研究对象,将应激性血糖升高指标按照百分位数分为Q1(0~25%)、Q2(>25%~75%)、Q3(>75%~100%)组,以是否发生ICU内死亡及在ICU内接受治疗的时间为结局变量,以人口学特征、实验室指标、合并症等为协变量,利用Cox回归及限制性立方样条探究应激性血糖升高和ICU患者28 d全因死亡风险之间的关联; 采用受试者工作特征(receiver operation characteristic, ROC)曲线下面积(area under curve, AUC)评价不同应激性血糖升高指标的预测效能,应激性血糖升高指标包括应激性血糖升高比值(stress hyperglycemia ratio, SHR) 1、SHR2、血糖间隙(glucose gap, GG); 进一步将应激性血糖升高指标纳入牛津急性疾病严重程度评分(Oxford acute severity of illness score, OASIS),探究其改善评分的预测效能,即采用AUC评估评分区分度,AUC越大表明评分区分度越好,采用Brier score评价评分校准度,Brier score越小,表明评分校准度越好。结果: 共纳入5 249例ICU患者,其中发生ICU内死亡的患者占7.56%。调整混杂因素后的Cox回归分析结果表明,SHR1、SHR2和GG的最高组Q3与最低组Q1相比,ICU患者28 d全因死亡HR(95%CI)分别为1.545(1.077~2.217)、1.602(1.142~2.249)和1.442(1.001~2.061),且随着应激性血糖升高指标的增加,ICU患者死亡风险也逐渐增加(Ptrend < 0.05)。限制性立方样条分析表明,SHR和28 d全因死亡风险之间呈线性关系(P>0.05)。SHR2和GG的AUC显著高于SHR1: AUCSHR2=0.691(95%CI: 0.661~0.720),AUCGG=0.685(95%CI: 0.655~0.714),AUCSHR1=0.680(95%CI: 0.650~0.709),P < 0.05。将SHR2纳入OASIS评分中,能显著提高评分的区分度和校准度:AUCOASIS=0.820(95%CI: 0.791~0.848),AUCOASIS+SHR2=0.832(95%CI: 0.804~0.859),P < 0.05; Brier scoreOASIS=0.071,Brier scoreOASIS+SHR2= 0.069。结论: 应激性血糖升高与ICU患者28 d全因死亡风险密切相关,可为重症监护患者的临床管理和决策提供参考。

关键词: 应激性血糖升高, 重症监护病房, 死亡风险, Cox回归, 限制性立方样条

Abstract:

Objective: To investigate the relationship between stress glucose elevation and the risk of 28 d all-cause mortality in intensive care unit (ICU) patients, and to compare the predictive efficacy of different stress glucose elevation indicators. Methods: ICU patients who met the inclusion and exclusion criteria in the Medical Information Mart for Intensive Care Ⅳ (MIMIC-Ⅳ) database were used as the study subjects, and the stress glucose elevation indicators were divided into Q1 (0-25%), Q2 (>25%- 75%), and Q3 (>75%-100%) groups, with whether death occurred in the ICU and the duration of treatment in the ICU as outcome variables, and demographic characteristics, laboratory indicators, and comorbidities as covariates, Cox regression and restricted cubic splines were used to explore the association between stress glucose elevation and the risk of 28 d all-cause death in ICU patients; and subject work characteristics [receiver operating characteristic (ROC) and the area under curve (AUC)] were used to evaluate the predictive efficacy of different stress glucose elevation indicators, The stress hyperglycemia indexes included: stress hyperglycemia ratio (SHR1, SHR2), glucose gap (GG); and the stress hyperglycemia index was further incorporated into the Oxford acute severity of illness score (OASIS) to investigate the predictive efficacy of the improved scores: the AUC was used to assess the score discrimination, and the larger the AUC indicated, the better score discrimination. The Brier score was used to evaluate the calibration of the score, and a smaller Brier score indicated a better calibration of the score. Results: A total of 5 249 ICU patients were included, of whom 7.56% occurred in ICU death. Cox regression analysis after adjusting for confounders showed that the HR (95%CI) for 28 d all-cause mortality in the ICU patients was 1.545 (1.077-2.217), 1.602 (1.142-2.249) and 1.442 (1.001-2.061) for the highest group Q3 compared with the lowest group Q1 for SHR1, SHR2 and GG, respectively, and The risk of death in the ICU patients increased progressively with increasing indicators of stressful blood glucose elevation (Ptrend < 0.05). Restricted cubic spline analysis showed a linear relationship between SHR and the 28 d all-cause mortality risk (P>0.05). the AUC of SHR2 and GG was significantly higher than that of SHR1: AUCSHR2=0.691 (95%CI: 0.661-0.720), AUCGG=0.685 (95%CI: 0.655-0.714), and AUCSHR1=0.680 (95%CI: 0.650-0.709), P < 0.05. The inclusion of SHR2 in the OASIS scores significantly improved the discrimination and calibration of the scores: AUCOASIS=0.820 (95%CI: 0.791-0.848), AUCOASIS+SHR2=0.832 (95%CI: 0.804-0.859), P < 0.05; Brier scoreOASIS=0.071, Brier scoreOASIS+SHR2=0.069. Conclusion: Stressful glucose elevation is strongly associated with 28 d all-cause mortality risk in ICU patients and may inform clinical management and decision making in intensive care patients.

Key words: Stress-induced hyperglycemia, Intensive care unit, Risk of death, Cox regression, Restricted cubic splines

中图分类号: 

  • R193.3

图1

研究对象纳入、排除流程图"

表1

5 249例ICU患者的基本特征"

Variables Total (n=5 249) Survival (n=4 852) Death (n=397) P value
Demographic characteristics
  Insurance, n(%) < 0.001
    Medicaid 302 (5.8) 289 (6.0) 13 (3.3)
    Medicare 2 289 (43.6) 2 074 (42.7) 215 (54.2)
    Other 2 658 (50.6) 2 489 (51.3) 169 (42.6)
  Marital status, n(%) < 0.001
    Divorced 407 (7.8) 378 (7.8) 29 (7.3)
    Married 2 788 (53.1) 2 594 (53.5) 194 (48.9)
    Single 1 372 (26.1) 1 280 (26.4) 92 (23.2)
    Widowed 682 (13.0) 600 (12.4) 82 (20.7)
  Length of stay/d, M(P25, P75) 2.24 (1.28, 4.58) 2.17 (1.26, 4.23) 4.25 (2.12, 9.16) < 0.001
  Male, n(%) 3 088 (58.8) 2 895 (59.7) 193 (48.6) < 0.001
  Age/year, M(P25, P75) 68.00 (56.00, 78.00) 67.00 (56.00, 77.00) 76.00 (62.00, 84.00) < 0.001
Complications
  Myocardial infarction, n(%) 1 410 (26.9) 1 292 (26.6) 118 (29.7) 0.201
  Congestive heart failure, n(%) 1 506 (28.7) 1 344 (27.7) 162 (40.8) < 0.001
  Peripheral vascular disease, n(%) 651 (12.4) 595 (12.3) 56 (14.1) 0.321
  Cerebrovascular disease, n(%) 1 999 (38.1) 1 769 (36.5) 230 (57.9) < 0.001
  Dementia, n(%) 176 (3.4) 152 (3.1) 24 (6.0) 0.003
  Chronic pulmonary disease, n(%) 1 042 (19.9) 953 (19.6) 89 (22.4) 0.205
  Rheumatic disease, n(%) 143 (2.7) 130 (2.7) 13 (3.3) 0.589
  Peptic ulcer, n(%) 63 (1.2) 56 (1.2) 7 (1.8) 0.406
  Mild liver disease, n(%) 291 (5.5) 238 (4.9) 53 (13.4) < 0.001
  Severe liver disease, n(%) 71 (1.4) 52 (1.1) 19 (4.8) < 0.001
  Diabetes with chronic complication, n(%) 550 (10.5) 507 (10.4) 43 (10.8) 0.878
  Diabetes without chronic complication, n(%) 1 561 (29.7) 1 439 (29.7) 122 (30.7) 0.695
  Paraplegia, n(%) 975 (18.6) 843 (17.4) 132 (33.2) < 0.001
  Renal disease, n(%) 896 (17.1) 791 (16.3) 105 (26.4) < 0.001
  Charlson comorbidity index, ±s 5.47±2.48 5.36±2.44 6.91±2.51 < 0.001
Vital signs,M(P25, P75)
  Heart rate/(beats/min) 79.97 (71.74, 89.58) 79.77 (71.72, 89.11) 83.61 (72.40, 95.48) < 0.001
  Respiratory rate/(times/min) 18.20 (16.58, 20.23) 18.08 (16.51, 20.04) 19.90 (17.81, 22.57) < 0.001
  Temperature/℃ 36.81 (36.62, 37.04) 36.81 (36.62, 37.02) 36.87 (36.62, 37.25) < 0.001
  Oxygen saturation/% 96.83 (95.60, 97.97) 96.80 (95.60, 97.93) 97.36 (95.61, 98.59) 0.001
  Weight/kg 84.13 (70.71, 100.08) 84.50 (71.19, 100.37) 80.00 (65.80, 96.00) < 0.001
Lab indexes, M(P25, P75)
  White blood cell count/(×109/L) 10.80 (8.27, 13.67) 10.60 (8.18, 13.48) 12.80 (10.25, 16.25) < 0.001
  Chloride/(mmol/L) 104.60 (101.67, 107.00) 104.50 (101.75, 107.00) 105.00 (100.05, 108.00) 0.157
  Creatinine/(mg/dL) 0.93 (0.75, 1.20) 0.90 (0.75, 1.20) 1.23 (0.87, 1.98) < 0.001
  AG/(mg/dL) 7.29 (6.39, 8.89) 7.22 (6.34, 8.72) 8.37 (7.02, 10.69) < 0.001
  Sodium/(mmol/L) 138.20 (136.20, 140.50) 138.02 (136.17, 140.28) 139.40 (136.67, 142.11) < 0.001
  Hemoglobin/(g/dL) 11.54 (10.06, 12.90) 11.59 (10.11, 12.96) 11.00 (9.45, 12.55) < 0.001
  Blood urea nitrogen/(mg/dL) 16.67 (12.50, 23.50) 16.00 (12.25, 22.50) 25.00 (16.00, 41.40) < 0.001
  Anion gap/(mEq/L) 14.00 (12.00, 16.00) 13.67 (12.00, 15.67) 16.00 (14.00, 18.31) < 0.001
  Potassium/(mEq/L) 4.14 (3.87, 4.42) 4.13 (3.88, 4.40) 4.17 (3.85, 4.56) 0.073
  Blood platelet count/(×109/L) 193.71 (152.56, 244.50) 193.00 (152.84, 243.66) 202.00 (150.67, 252.00) 0.547
  Thrombin time/s 13.27 (12.05, 14.70) 13.20 (12.00, 14.60) 13.75 (12.35, 16.10) < 0.001
  Prothrombin time/s 30.65 (27.30, 38.70) 30.56 (27.30, 38.28) 31.70 (28.40, 47.65) < 0.001
  International normalized ratio 1.20 (1.10, 1.30) 1.20 (1.10, 1.30) 1.25 (1.10, 1.50) < 0.001
  Bicarbonate/(mEq/L) 23.50 (21.60, 25.40) 23.67 (22.00, 25.50) 21.80 (19.00, 24.00) < 0.001
  Haematocrit/% 34.70 (30.90, 38.80) 34.80 (31.07, 38.80) 33.88 (29.05, 38.40) 0.004
  Red blood cell distribution width/% 13.76 (13.10, 14.70) 13.70 (13.10, 14.65) 14.40 (13.60, 15.80) < 0.001
  Calcium/(mg/dL) 8.65 (8.20, 9.00) 8.65 (8.24, 9.00) 8.53 (8.10, 9.00) 0.003
  HbA1c/% 5.90 (5.50, 6.80) 5.86 (5.50, 6.80) 5.90 (5.50, 6.70) 0.798
Scores, M(P25, P75)
  GCS 13.00 (10.00, 14.00) 14.00 (11.00, 14.00) 8.00 (6.00, 11.00) < 0.001
SIH-related index
  SHR1, M(P25, P75) 1.04 (0.90, 1.20) 1.03 (0.90, 1.18) 1.19 (1.01, 1.42) < 0.001
  GG, M(P25, P75) 0.28 (-0.71, 1.31) 0.20 (-0.75, 1.22) 1.31 (0.11, 2.87) < 0.001
  SHR2, M(P25, P75) 1.20 (1.06, 1.37) 1.19 (1.05, 1.35) 1.39 (1.19, 1.64) < 0.001
  SHR1 tertile, n(%) < 0.001
    Q1(≤0.90) 1 288 (24.5) 1 241 (25.6) 47 (11.8)
    Q2(>0.90, ≤1.20) 2 681 (51.1) 2 523 (52.0) 158 (39.8)
    Q3(>1.20) 1 280 (24.4) 1 088 (22.4) 192 (48.4)
  SHR2 tertile, n(%) < 0.001
    Q1(≤1.06) 1 342 (25.6) 1 289 (26.6) 53 (13.4)
    Q2(>1.06, ≤1.37) 2 594 (49.4) 2 456 (50.6) 138 (34.8)
    Q3(>1.37) 1 313 (25.0) 1 107 (22.8) 206 (51.9)
  GG tertile, n(%) < 0.001
    Q1(≤-0.71) 1 320 (25.1) 1 270 (26.2) 50 (12.6)
    Q2(>-0.71, ≤1.32) 2 631 (50.1) 2 482 (51.2) 149 (37.5)
    Q3(>1.32) 1 298 (24.7) 1 100 (22.7) 198 (49.9)

图2

3种SIH指标分组Kaplan-Meier曲线"

表2

SIH与ICU患者28 d死亡风险的关联"

VariablesModel 1 Model 2 Model 3
HR(95%CI) P Ptrend HR(95%CI) P Ptrend HR(95%CI) P Ptrend
SHR1 3.692(2.793, 4.881) < 0.001 4.250(3.127, 5.776) < 0.001 2.037(1.427, 2.908) < 0.001
SHR1 tertile < 0.001 < 0.001 < 0.001
  Q1(≤0.90) Reference Reference Reference
  Q2(>0.90, ≤1.20) 1.421 (1.013, 1.992) 0.042 1.254 (0.889, 1.768) 0.198 1.068 (0.753, 1.516) 0.712
  Q3(>1.20) 2.663 (1.907, 3.710) < 0.001 2.548 (1.816, 3.576) < 0.001 1.545 (1.077, 2.217) 0.018
SHR2 3.580 (2.767, 4.632) 4.098 (3.084, 5.445) < 0.001 2.059 (1.488, 2.850)
SHR2 tertile < 0.001 < 0.001 < 0.001
  Q1(≤1.06) Reference Reference Reference
  Q2(>1.06, ≤1.37) 1.188 (0.856, 1.648) 0.302 1.163 (0.836, 1.619) 0.206 1.057 (0.754, 1.482) 0.747
  Q3(>1.37) 2.558 (1.869, 3.502) < 0.001 2.615 (1.902, 3.596) < 0.001 1.602 (1.142, 2.249) 0.006
GG 1.215 (1.164, 1.269) < 0.001 1.229 (1.172, 1.289) < 0.001 1.110 (1.055, 1.168) < 0.001
GG tertile < 0.001 < 0.001 < 0.001
  Q1(≤-0.71) Reference Reference Reference
  Q2(>-0.71, ≤1.32) 1.407 (1.005, 1.971) 0.047 1.215 (0.860, 1.718) 0.270 1.014 (0.711, 1.445) 0.940
  Q3(>1.32) 2.739 (1.972, 3.805) < 0.001 2.519 (1.802, 3.522) < 0.001 1.442 (1.001, 2.061) 0.044

图3

SIH限制性立方样条图"

表3

血糖相关指标的AUC比较"

Variables AUC(95%CI) Pa Pb Pc Pd
Hba1c 0.504 (0.475-0.532)
AG 0.650 (0.618-0.675) < 0.001
SHR1 0.680 (0.650-0.709) < 0.001 0.015
SHR2 0.691 (0.661-0.720) < 0.001 < 0.001 0.007
GG 0.685 (0.655-0.714) < 0.001 0.005 0.018 0.111

图4

血糖相关指标ROC曲线"

图5

不同亚组分析森林图"

1 Mousai O , Tafoureau L , Yovell T , et al.Clustering analysis of geriatric and acute characteristics in a cohort of very old patients on admission to ICU[J].Intensive Care Med,2022,48(12):1726-1735.
doi: 10.1007/s00134-022-06868-x
2 Dungan KM , Braithwaite SS , Preiser JC .Stress hyperglycaemia[J].Lancet,2009,373(9677):1798-1807.
doi: 10.1016/S0140-6736(09)60553-5
3 Harp JB , Yancopoulos GD , Gromada J .Glucagon orchestrates stress-induced hyperglycaemia[J].Diabetes Obes Metab,2016,18(7):648-653.
doi: 10.1111/dom.12668
4 Roberts GW , Quinn SJ , Valentine N , et al.Relative hyperglycemia, a marker of critical illness: Introducing the stress hyperglycemia ratio[J].J Clin Endocrinol Metab,2015,100(12):4490-4497.
doi: 10.1210/jc.2015-2660
5 Liao WI , Wang JC , Chang WC , et al.Usefulness of glycemic gap to predict ICU mortality in critically ill patients with diabetes[J].Medicine (Baltimore),2015,94(36):e1525.
doi: 10.1097/MD.0000000000001525
6 Lee TF , Drake SM , Roberts GW , et al.Relative hyperglycemia is an independent determinant of in-hospital mortality in patients with critical illness[J].Critical Care Medicine,2020,48(2):e115-e122.
doi: 10.1097/CCM.0000000000004133
7 Mcdonnell ME , Garg R , Gopalakrishnan G , et al.Glycemic gap predicts mortality in a large multicenter cohort hospitalized with covid-19[J].J Clin Endocrinol Metab,2023,108(3):718-725.
doi: 10.1210/clinem/dgac587
8 Xia Z , Gu T , Zhao Z , et al.The stress hyperglycemia ratio, a novel index of relative hyperglycemia, predicts short-term mortality in critically ill patients after esophagectomy[J].J Gastrointest Oncol,2022,13(1):56-66.
doi: 10.21037/jgo-22-11
9 Chen G , Li M , Wen X , et al.Association between stress hyperglycemia ratio and in-hospital outcomes in elderly patients with acute myocardial infarction[J].Front Cardiovasc Med,2021,8,698725.
doi: 10.3389/fcvm.2021.698725
10 Zhu B , Pan Y , Jing J , et al.Stress hyperglycemia and outcome of non-diabetic patients after acute ischemic stroke[J].Front Neurol,2019,10,1003.
doi: 10.3389/fneur.2019.01003
11 Guo Y , Wang G , Jing J , et al.Stress hyperglycemia may have higher risk of stroke recurrence than previously diagnosed diabetes mellitus[J].Aging (Albany NY),2021,13(6):9108-9118.
12 Johnson A, Bulgarelli L, Pollard T, et al. Mimic-Ⅳ documentation (version 1.0)[EB/OL]. (2021-01-01)[2022-10-01]. https://mimic.mit.edu/docs/iv/
13 Koyfman L , Brotfain E , Erblat A , et al.The impact of the blood glucose levels of non-diabetic critically ill patients on their clinical outcome[J].Anaesthesiol Intensive Ther,2018,50(1):20-26.
doi: 10.5603/AIT.2018.0004
14 Olariu E , Pooley N , Danel A , et al.A systematic scoping review on the consequences of stress-related hyperglycaemia[J].PLoS One,2018,13(4):e0194952.
doi: 10.1371/journal.pone.0194952
15 Johnson AE , Kramer AA , Clifford GD .A new severity of illness scale using a subset of acute physiology and chronic health evaluation data elements shows comparable predictive accuracy[J].Cri-tical Care Medicine,2013,41(7):1711-1718.
doi: 10.1097/CCM.0b013e31828a24fe
16 Su YW , Hsu CY , Guo YW , et al.Usefulness of the plasma glucose concentration-to-HbA1c ratio in predicting clinical outcomes during acute illness with extreme hyperglycaemia[J].Diabetes Metab,2017,43(1):40-47.
doi: 10.1016/j.diabet.2016.07.036
17 Allison PD .Multiple imputation for missing data: A cautionary tale[J].Sociol Methods Res,2000,28(3):301-309.
doi: 10.1177/0049124100028003003
18 Murphy AH .A new decomposition of the brier score: Formulation and interpretation[J].Mon Weather Rev,1986,114(12):2671-2673.
doi: 10.1175/1520-0493(1986)114<2671:ANDOTB>2.0.CO;2
19 Nicolau JC , Serrano CV Jr , Giraldez RR , et al.In patients with acute myocardial infarction, the impact of hyperglycemia as a risk factor for mortality is not homogeneous across age-groups[J].Diabetes Care,2012,35(1):150-152.
doi: 10.2337/dc11-1170
20 Merlino G , Pez S , Gigli GL , et al.Stress hyperglycemia in patients with acute ischemic stroke due to large vessel occlusion undergoing mechanical thrombectomy[J].Front Neurol,2021,12,725002.
doi: 10.3389/fneur.2021.725002
21 Li W , Ning Y , Ma Y , et al.Association of lung function and blood glucose level: A 10-year study in China[J].BMC Pulm Med,2022,22(1):444.
doi: 10.1186/s12890-022-02208-3
22 Zonneveld TP , Nederkoorn PJ , Westendorp WF , et al.Hyperglycemia predicts poststroke infections in acute ischemic stroke[J].Neurology,2017,88(15):1415-1421.
doi: 10.1212/WNL.0000000000003811
23 Ergul A , Abdelsaid M , Fouda AY , et al.Cerebral neovascularization in diabetes: Implications for stroke recovery and beyond[J].J Cereb Blood Flow Metab,2014,34(4):553-563.
doi: 10.1038/jcbfm.2014.18
24 Cai ZM , Zhang MM , Feng RQ , et al.Fasting blood glucose-to-glycated hemoglobin ratio and all-cause mortality among chinese in-hospital patients with acute stroke: A 12-month follow-up study[J].BMC Geriatr,2022,22(1):508.
doi: 10.1186/s12877-022-03203-3
[1] 袁雯,张奕,陈力,蒋家诺,陈曼曼,刘婕妤,马涛,马奇,崔孟杰,郭桐君,王鑫鑫,董彦会,马军. 儿童青少年身体脂肪分布与抑郁和社交焦虑的关联:基于双能X线检测的横断面研究[J]. 北京大学学报(医学版), 2023, 55(3): 429-435.
[2] 赵亚楠,范慧芸,王翔宇,罗雅楠,张嵘,郑晓瑛. 孤独症患者过早死亡风险及死亡原因[J]. 北京大学学报(医学版), 2023, 55(2): 375-383.
[3] 刘杰,郭超. 正/负性情绪对中国老年人死亡风险影响的前瞻性队列研究[J]. 北京大学学报(医学版), 2022, 54(2): 255-260.
[4] 林瑜,吴静依,蔺轲,胡永华,孔桂兰. 基于集成学习模型预测重症患者再入重症监护病房的风险[J]. 北京大学学报(医学版), 2021, 53(3): 566-572.
[5] 唐雯,高峻逸,马辛宇,张超贺,马连韬,王亚沙. 循环神经网络模型在腹膜透析临床预后预测中的初步应用[J]. 北京大学学报(医学版), 2019, 51(3): 602-608.
[6] 蔺轲,谢俊卿,胡永华,孔桂兰. 支持向量机在ICU急性肾损伤患者住院死亡风险预测中的应用[J]. 北京大学学报(医学版), 2018, 50(2): 239-244.
Viewed
Full text


Abstract

Cited

  Shared   
  Discussed   
No Suggested Reading articles found!