北京大学学报(医学版) ›› 2020, Vol. 52 ›› Issue (3): 500-505. doi: 10.19723/j.issn.1671-167X.2020.03.016

• 论著 • 上一篇    下一篇

中国中老年人失能状况公平性与影响因素

王哲斌,郑志杰()   

  1. 北京大学公共卫生学院全球卫生学系,北京 100191
  • 收稿日期:2020-02-17 出版日期:2020-06-18 发布日期:2020-06-30
  • 通讯作者: 郑志杰 E-mail:zhengzj@bjmu.edu.cn
  • 基金资助:
    国家自然科学基金(71904004)

Research on equity and influencing factors of disability among Chinese middle-aged and old people

Zhe-bin WANG,Zhi-jie ZHENG()   

  1. Department of Global Health, Peking University School of Public Health, Beijing 100191, China
  • Received:2020-02-17 Online:2020-06-18 Published:2020-06-30
  • Contact: Zhi-jie ZHENG E-mail:zhengzj@bjmu.edu.cn
  • Supported by:
    National Natural Science Foundation of China(71904004)

摘要:

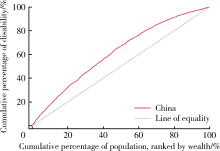
目的 分析中国50岁及以上中老年人失能状况和失能状况公平性,并探究中老年人失能状况不公平的主要影响因素。方法 利用全球老龄化与成人健康研究(Study on Global Ageing and Adult Health,SAGE)中国2007—2010年第一轮调查数据,计算集中指数和集中曲线,并对集中指数进行分解。结果 中国中老年人失能评估量表平均分为7.32,中老年男性平均分为6.37,女性平均分为8.21。中老年人失能状况集中指数为-0.190 9,中老年男性为-0.184 4,中老年女性为-0.196 1。对集中指数进行分解后,社会经济地位对中老年人失能状况不公平的贡献较高,包括经济水平、受教育程度和工作类型,贡献率分别为66.41%、16.45%和13.10%。与社会结构因素相比,中老年人吸烟、饮酒和身体活动情况等个人生活方式因素的贡献率较低。结论 中国存在中老年人失能状况不公平,较好的健康状况集中在经济水平较好的中老年人群中。中老年男性失能状况较女性更轻,且失能状况不公平程度更小。经济水平、受教育程度和工作类型是对中国中老年人失能状况不公平贡献率较高的主要因素,提示仅通过促进中老年人健康生活方式不能够有效减少失能状况在经济水平较好和较差的中老年人群中的差异。政府需要在重视促进中老年人健康的基础上,进一步加强和完善适宜的社会和医疗保障措施,将减少中老年人健康不公平作为政策重点,尤其应该向发展相对滞后、中老年人相对聚集的地区重点分配医疗卫生和其他相关社会资源,同时应该加大对中老年人健康和健康公平相关研究的支持,为积极应对人口老龄化和制定政策收集证据。

关键词: 中老年, 失能, 公平性, 集中指数

Abstract:

Objective: To evaluate disability status and equity of the middle-aged and old population in China, and to explore the influencing factors contributing to the inequity of disability.Methods: This study was based on data collected from the first wave survey (2007—2010) of World Health Organization Study on Global Ageing and Adult Health (SAGE). Concentration index (CI) and concentration curve were calculated to measure the economic-related inequity of disability among the Chinese middle-aged and old people. The CI was further decomposed in which the attributions of social and individual determinants were calculated.Results: The mean score of the World Health Organization Disability Assessment Sche-dule (WHODAS) was 7.32 among the Chinese middle-aged and old people, 6.37 for males and 8.21 for females. The CI for the whole participants was -0.190 9, compared with -0.184 4 for the middle-aged and old men and -0.196 1 for the women. After decomposition of the CI, socioeconomic status contributed most to disability inequity among the Chinese middle-aged and old population. Financial status, educational level and work type contributed 66.41%, 16.45% and 13.10% respectively to inequity of disability. Individual lifestyle factors, including tobacco use, alcohol consumption and physical activities, contributed less to inequity of disability compared with social structural determinants.Conclusion: There was inequity of disability among Chinese middle-aged and old population, and those with better financial status were less likely to suffer from functional disability. Middle-aged and old males were less disabled than females, and had less inequity of disability. Financial status, educational level and work type took the highest contribution to inequity of disability among Chinese middle-aged and old population, suggesting that promoting healthy lifestyles alone cannot effectively reduce the inequity of disability. The government needs to continually strengthen and improve appropriate social and medical protection measures on the basis of the importance it attaches to the health of the middle-aged and old population, and makes reducing health inequities a policy priority. The government should pay attention to the provision of healthcare and other resources in areas where development is relatively lagging and where there is a relative concentration of middle-aged and old population. Meanwhile, there should be more significant support for research on health status and equity among the middle-aged and old population to obtain more evidence for proactive responses to rapid population aging in China and policy development.

Key words: Middle-aged and old people, Disability, Equity, Concentration index

中图分类号: 

  • R197.1

表2

中国中老年人失能状况集中指数"

Items Concentration index 95% confidence interval
All -0.190 9 -0.335 7 to -0.046 1
Male -0.184 4 -0.329 3 to -0.039 6
Female -0.196 1 -0.340 8 to -0.051 4

表1

中国不同人口学特征中老年人的分布和失能评分"

Variables Percentage WHODAS score, x?±s
Average WHODAS score n=11 656 7.32±10.76
Gender
Male 48.40% 6.37±10.23
Female 51.60% 8.21±11.16
Age/years
50-59 43.39% 4.32±6.86
60-69 29.94% 6.91±9.40
70-79 21.24% 11.17±13.27
80 and above 5.42% 18.42±18.10
Economic status
Lowest 20.00% 11.74±13.12
Low and middle 20.00% 8.68±11.34
Middle 20.01% 7.43±10.65
Middle and high 20.00% 5.52±8.84
Highest 20.00% 3.21±6.70
Education
Beyond college/university 4.18% 3.10±7.03
High school 11.80% 3.90±7.17
Junior high school 19.54% 4.69±8.06
Primary school 20.35% 6.57±9.67
Less than primary school 18.57% 7.30±9.44
No formal education 25.56% 12.19±13.95
Employment
Never work 12.06% 11.11±12.83
Public 35.66% 5.39±8.81
Private 8.85% 4.56±8.43
Self 41.00% 8.41±11.55
Informal 2.42% 8.24±11.02
Residence
Urban 46.48% 6.01±9.70
Rural 53.52% 8.45±11.48
Marital status
Currently married 82.99% 6.42±9.78
Other marital status 17.01% 11.68±13.82
Household size
Single 10.84% 9.59±11.98
Two person 46.53% 7.39±10.56
Three persons 18.77% 6.40±10.37
Four persons and above 23.87% 6.85±10.72
Medical insurance
With medical insurance 87.91% 7.10±10.77
No medical insurance 12.09% 8.87±10.56
Tobacco use
Never smoke 66.35% 7.65±10.91
Not current smoker 6.42% 8.24±13.21
Smoker, not daily 2.43% 6.81±11.48
Current daily smoker 24.80% 6.24±9.43
Alcohol consumption
Never drink 69.00% 7.86±11.19
Infrequent drinker 10.21% 8.04±12.20
Frequent drinker 20.79% 5.19±8.00
Physical activity
High level 39.96% 5.63±7.67
Moderate level 28.23% 6.24±8.85
Low level 31.81% 10.39±14.38

图1

中国中老年人失能状况集中曲线"

表3

中国中老年人失能状况集中指数分解结果"

Variables Contribution percentages
All Male Female
Financial status 65.58% 76.25% 55.36%
Education 16.56% 11.84% 19.02%
Employment 12.90% 12.99% 10.58%
Residence 10.66% 2.23% 20.79%
Marital status 3.78% 3.38% 4.17%
Household size -1.46% -0.79% -0.71%
Medical insurance -0.21% -1.13% 0.65%
Tobacco use -0.26% 0.12% -1.43%
Alcohol consumption 0.32% 0.34% 0.22%
Physical activity -4.95% -5.29% -4.48%
[1] World Health Organization. World report on ageing and health [R]. Geneva: World Health Organization, 2015: 246.
[2] Jones GW. Ageing in China, India and Indonesia: an overview[M] // Contemporary demographic transformations in China, India and Indonesia. Berlin: Springer, 2016: 325-328.
[3] United Nations. Department of economic and social affairs, population division (2013), world population ageing 2013[M]. New York: United Nations publication, 2013.
[4] Crimmins EM, Beltrán-Sánchez H. Mortality and morbidity trends: is there compression of morbidity?[J]. J Gerontol B Psychol Sci Soc Sci, 2011,66(1):75-86.
pmid: 21135070
[5] Wang XQ, Chen PJ. Population ageing challenges health care in China[J]. Lancet, 2014,383(9920):870.
[6] Du P, Wang Y. Population ageing and the development of social care service systems for older persons in China[J]. Int J Ageing Dev C, 2016,1(1):40-52.
[7] Chen X, Huang B, Li S. Population ageing and inequality: Evidence from China[J]. World Economy, 2018,41(8):1976-2000.
[8] Fan C, Ouyang W, Tian L, et al. Elderly health inequality in China and its determinants: a geographical perspective[J]. Int J Environ Res Public Health, 2019,16(16):2953.
[9] Zhong Y, Wang J, Nicholas S. Gender, childhood and adult socioeconomic inequalities in functional disability among Chinese older adults[J]. Int J Equity Health, 2017,16(1):165.
[10] Yang L, Konttinen H, Martikainen P, et al. Socioeconomic status and physical functioning: a longitudinal study of older Chinese people[J]. J Gerontol B Psychol Sci Soc Sci, 2018,73(7):1315-1329.
pmid: 28329825
[11] International Health Conference. Constitution of the World Health Organization. 1946[J]. Bull World Health Organ, 2002,80(12):983-984.
[12] O’Donnell O, Doorslaer EV, Wagstaff A, et al. Analyzing health equity using household survey data: A guide to techniques and their implementation[J]. World Bank, 2008,86(10):816-816.
[13] Üstuün TB, Ebrary I. Measuring health and disability: manual for WHO Disability Assessment Schedule WHODAS 2.0 [R]. Geneva: World Health Organization, 2010.
[14] Murray CJL, Evans DB. Health systems performance assessment: Debates, methods and empiricism[M]. Geneva: World Health Organization, 2003.
[15] Bull FC, Maslin TS, Armstrong T. Global physical activity questionnaire (GPAQ): nine country reliability and validity study[J]. J Phys Act Health, 2009,6(6):790-804.
doi: 10.1123/jpah.6.6.790 pmid: 20101923
[16] Armstrong T, Bull F. Development of the World Health Organization Global Physical Activity Questionnaire (GPAQ)[J]. J Public Health, 2006,14(2):66-70.
[17] van Doorslaer E, Koolman X. Explaining the differences in income—related health inequalities across European countries[J]. Health Econ, 2004,13(7):609-628.
pmid: 15259042
[18] Macinko J, Harris MJ, Rocha MG. Brazil’s National Program for Improving Primary Care Access and Quality (PMAQ): fulfilling the potential of the world’s largest payment for performance system in primary care[J]. J Ambul Care Manage, 2017,40(2 Suppl):S4-S11.
[19] 赵梓行. 均等化视角下印度医疗服务体系管理研究[D]. 湖南: 湘潭大学, 2018.
[20] Adriano M, Thomas H, Gomes LFA, et al. The Brazilian health system at crossroads: progress, crisis and resilience[J]. BMJ Global Health, 2018,3(4):e000829.
[21] Balarajan Y, Selvaraj S, Subramanian SV. Health care and equity in India[J]. Lancet, 2011,377(9764):505-515.
pmid: 21227492
[22] Sharma JK, Narang R. Quality of healthcare services in rural India: the user perspective[J]. Vikalpa, 2011,36(1):51-60.
[1] 冯星淋, 沈娟, 郭岩. 儿童健康公平性的社会决定因素研究[J]. 北京大学学报(医学版), 2010, 42(3): 252-257.
Viewed
Full text


Abstract

Cited

  Shared   
  Discussed   
[1] 张三. 中文标题测试[J]. 北京大学学报(医学版), 2010, 42(1): 1 -10 .
[2] 赵磊, 王天龙 . 右心室舒张末期容量监测用于肝移植术中容量管理的临床研究[J]. 北京大学学报(医学版), 2009, 41(2): 188 -191 .
[3] 万有, , 韩济生, John E. Pintar. 孤啡肽基因敲除小鼠电针镇痛作用增强[J]. 北京大学学报(医学版), 2009, 41(3): 376 -379 .
[4] 张燕, 韩志慧, 钟延丰, 王盛兰, 李玲玲, 郑丹枫. 骨骼肌活组织检查病理诊断技术的改进及应用[J]. 北京大学学报(医学版), 2009, 41(4): 459 -462 .
[5] 赵奇, 薛世华, 刘志勇, 吴凌云. 同向施压测定自酸蚀与全酸蚀粘接系统粘接强度[J]. 北京大学学报(医学版), 2010, 42(1): 82 -84 .
[6] 林红, 王玉凤, 吴野平. 学校生活技能教育对小学三年级学生行为问题影响的对照研究[J]. 北京大学学报(医学版), 2007, 39(3): 319 -322 .
[7] 丰雷, 程嘉, 王玉凤. 注意缺陷多动障碍儿童的运动协调功能[J]. 北京大学学报(医学版), 2007, 39(3): 333 -336 .
[8] 李岳玲, 钱秋瑾, 王玉凤. 儿童注意缺陷多动障碍成人期预后及其预测因素[J]. 北京大学学报(医学版), 2007, 39(3): 337 -340 .
[9] . 书讯[J]. 北京大学学报(医学版), 2007, 39(3): 225 -328 .
[10] 牟向东, 王广发, 刁小莉, 阙呈立. 肺黏膜相关淋巴组织型边缘区B细胞淋巴瘤一例[J]. 北京大学学报(医学版), 2007, 39(4): 346 -350 .