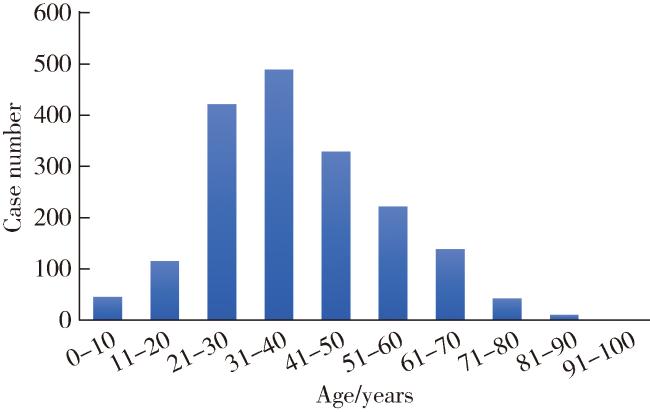
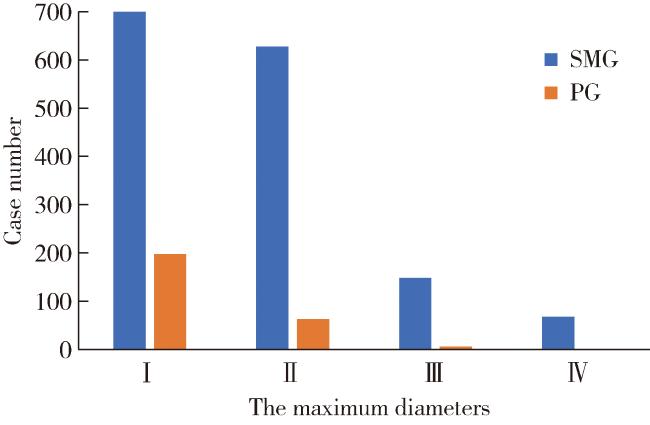
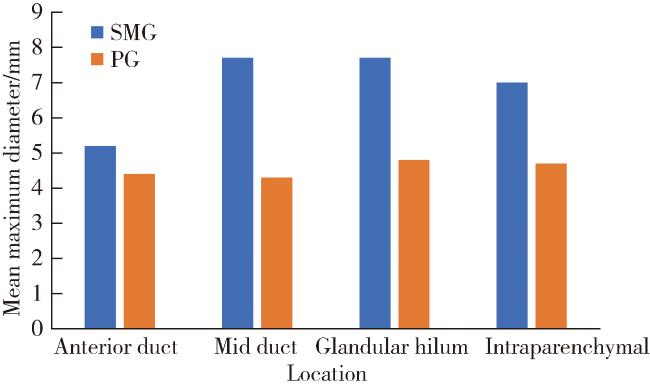
1 资料与方法
1.1 研究对象
1.2 研究内容
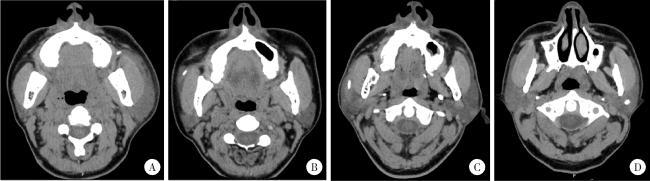
图1 螺旋CT轴位图像显示腮腺导管系统结石Figure 1 Axial images of spiral CT showing the calculi in the parotid duct system A, calculus in the anterior segment of the left parotid duct; B, calculus in the middle segment of the right parotid duct; C, calculus at the hilum region of the right parotid duct; D, intraglandular calculus of the left parotid gland. |
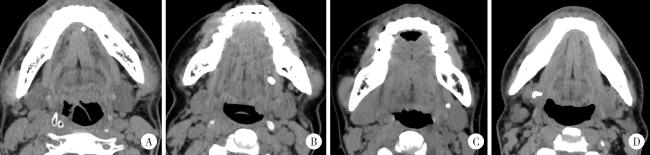
图2 螺旋CT轴位图像显示下颌下腺导管系统结石Figure 2 Axial images of spiral CT showing the calculi of the submandibular gland A, calculus in the anterior segment of the left submandibular gland duct; B, calculus in the middle segment of the left submandibular gland duct; C, calculus at the hilum region of the left submandibular gland; D, intraglandular calculus of the right submandibular gland. |
1.3 统计学分析
2 结果
2.1 唾液腺结石病患者的基本特征与腺体分布
表1 1 808例唾液腺结石病患者的临床特征Table 1 Clinical features of 1 808 patients with sialolithiasis |
| Items | Total (n=1 808)a | Type of affected glands | P value | |
| SMG | PG | |||
| Number | 1 808 | 1 541 | 267 | |
| Gender, n (%) | 0.628 | |||
| Male | 854 (47.2) | 732 (47.5) | 122 (45.7) | |
| Female | 954 (52.8) | 809 (52.5) | 145 (54.3) | |
| Age/years, $\bar x \pm s$ | 39.0±15.0 | 38.0±15.0 | 48.0±16.0 | <0.001 |
| Duration of symptoms/month, M (P25, P75) | 6.0 (1.0, 24.0) | 6.0 (1.0, 24.0) | 4.3 (1.0, 24.0) | 0.302 |
| Unilateral/Bilateral, n (%) | 0.327 | |||
| Left | 844 (46.7) | 724 (47.0) | 120 (44.9) | |
| Right | 935 (51.7) | 795 (51.6) | 140 (52.4) | |
| Bilateral | 29 (1.6) | 22 (1.4) | 7 (2.6) | |
| Quantity, n (%) | 0.062 | |||
| Single | 1 162 (64.3) | 974 (63.2) | 188 (70.4) | |
| Multiple | 621 (34.3) | 545 (35.4) | 76 (28.4) | |
| Recurrent | 25 (1.4) | 22 (1.4) | 3 (1.1) | |
| Location, n (%) | <0.001 | |||
| Anterior duct | 581 (32.1) | 460 (29.8) | 121 (45.3) | |
| Mid duct | 394 (21.8) | 315 (20.4) | 79 (29.6) | |
| Glandular hilum | 669 (37.0) | 639 (41.5) | 30 (11.2) | |
| Intraparenchymal | 164 (9.1) | 127 (8.2) | 37 (13.9) | |
| Mean maximum diameter/mm, $\bar x \pm s$ | 6.5±4.6 | 6.9±4.8 | 4.5±2.5 | <0.001 |
| Long-to-short diameter ratio, $\bar x \pm s$ | 1.6±1.0 | 1.6±0.9 | 1.7±1.1 | 0.007 |
a, the 4 patients in whom both SMG and PG were affected were not included into this statistical comparison. SMG, submandibular gland; PG, parotid gland. |