1 资料与方法
1.1 一般资料
1.2 试剂和材料
表1 AIM2炎症小体通路基因引物序列Table 1 The primer sequences for AIM2 inflammasome pathway genes |
| Gene | Forward primer | Reverse primer |
| GAPDH | 5′-ACAACTTTGGTATCGTGGAAGG-3′ | 5′-GCCATCACGCCACAGTTTC-3′ |
| AIM2 | 5′-AGCAAGATATTATCGGCACAGTG-3′ | 5′-GTTCAGCGGGACATTAACCTT-3′ |
| caspase-1 | 5′-TTTCCGCAAGGTTCGATTTTCA-3′ | 5′-GGCATCTGCGCTCTACCATC-3′ |
| GSDMD | 5′-GTGTGTCAACCTGTCTATCAAGG-3′ | 5′-CATGGCATCGTAGAAGTGGAAG-3′ |
| IL-1β | 5′-TGAGCTCGCCAGTGAAATGAT-3′ | 5′-TGCTGTAGTGGTGGTCGGAG-3′ |
| IL-18 | 5′-TTCAAGACCAGCCTGACCAAC-3′ | 5′-GCTCACCACAACCTCTACCTCC-3′ |
GAPDH, glyceraldehyde-3-phosphate dyhydrogenase; AIM2, absent in melanoma 2; caspase-1, cysteine aspartate-specific protease-1; GSDMD, gasdermin D; IL-1β, interleukin 1β; IL-18, interleukin 18. |
1.3 疾病严重程度和活动度评估
1.4 荧光定量法检测血清中的dsDNA
1.5 实时定量逆转录PCR法检测AIM2、caspase-1、GSDMD、IL-1β、IL-18 mRNA表达
1.6 蛋白免疫印记法测定AIM2、caspase-1、GSDMD、IL-1β和IL-18蛋白水平
1.7 ELISA法检测血清中IL-1β和IL-18表达水平
1.8 统计学分析
2 结果
2.1 IIM患者中肌炎相关抗体和特异性抗体的分布情况
2.2 各组的临床资料与外周血特征
表2 健康对照组和IIM组及其各亚组患者临床资料与实验室指标比较Table 2 Comparison of clinical data and laboratory indicators among the health control group, IIM group and its subgroups |
| Items | IIM group | |||||
| DM subgroup (n = 10) | PM subgroup (n = 5) | OM subgroup (n = 11) | IMNM subgroup (n = 4) | Total (n = 30) | HC group (n = 30) | |
| Demographic characteristics | ||||||
| Female | 9 (90.0) | 3 (60.0) | 8 (72.7) | 2 (50.0) | 22 (73.3) | 20 (66.7) |
| Age/years | 59.3 ± 11.7 | 52.6 ± 3.9 | 55.3 ± 15.5 | 65.5 ± 13.5 | 55.0 ± 15.1 | 53.1 ± 8.4 |
| Duration/months | 5.5 (3.5 – 12.3) | 24.0 (8.5 – 66.0) | 12.0 (1.0 – 180.0) | 14.0 (5.0 – 14.8) | ||
| Assessment of disease severity and activity | ||||||
| VAS score | 76.8 ± 9.4 | 75.7 ± 5.1 | 69.7 ± 21.5 | 68.3 ± 38.8 | ||
| MMT score | 65.1 ± 14.6 | 75.0 ± 3.0 | 66.0 ± 17.4 | 68.7 ± 16.3 | ||
| MYOACT score | 3.2 ± 0.9 | 2.6 ± 1.2 | 4.4 ± 1.2 | 3.9 ± 0.7 | ||
| MDAAT score | 7.0 (3.8 – 8.3) | 6.0 (4.3 – 8.5) | 6.0 (4.5 – 8.0) | 4.0 (3.3 – 6.3) | ||
| MDI score | 3.0 (2.0 – 7.5) | 5.0 (3.0 – 7.5) | 9.0 (4.0 – 19.0) | 2.5 (1.3 – 6.0) | ||
| Laboratory indicators | ||||||
| WBC/(×109/L) | 6.6 (6.0 – 7.4) | 7.0 (4.7 – 11.3) | 10.1 (5.5 – 12.4) | 10.1 (5.5 – 12.4) | 6.9 (6.1 – 8.7)* | 5.9 (5.0 – 6.5) |
| LY/(×109/L) | 1.1 (0.5 – 28.2)** | 0.8 (0.7 – 2.1) | 1.5 (0.7 – 1.8) | 1.6 (1.0 – 1.7) | 1.2 (0.5 – 28.2) | 1.4 (0.3 – 3.5) |
| Hb/(g/L) | 119.3 ± 17.1* | 136.2 ± 15.3 | 126.9 ± 18.4 | 130.3 ± 9.4 | 126.4 ± 16.9* | 140.0 ± 12.7 |
| ALT/(U/L) | 50.3 (9.0 – 290.4)** | 123.0 (47.0 – 340.0)* | 31.0 (11.0 – 340.0) | 81.0 (80.0 – 410.9)**▲ | 55.5 (9.0 – 410.9)* | 25.5 (10.0 – 89.0) |
| AST/(U/L) | 104.0 (12.0 – 441.7)** | 107.0 (27.0 – 266.0)* | 25.0 (10.0 – 136.0)△ | 106.0 (73.0 – 589.1)**▲ | 76.0 (10.0 – 441.7)* | 20.5 (13.0 – 55.0) |
| LDH/(U/L) | 513.5 (169.0 – 808.0)** | 543.0 (184.0 – 1335.0)** | 255.0 (162.0 – 1595.0)** | 1858.5 (891.0 – 1957.0)**▲▲ | 551.0 (162.0 – 1957.0)* | 174.0 (98.0 – 278.0) |
| CK/(U/L) | 442.0 (27.0 – 716.2)** | 2 554.0 (55.0 – 7690.0)** | 149.0 (36.0 – 1031.0)**△ | 3428.5 (131.0 – 1679.0)**▲▲ | 488.0 (27.0 – 1639.0)* | 90.0 (21.0 – 178.0) |
| CK-MB/(U/L) | 54.0 (13.1 – 573.5)** | 60.8 (9.8 – 432.3)** | 12.1 (9.0 – 54.1)**△ | 200.0 (181.4 – 899.2)**▲▲ | 31.35 (9.0 – 899.0)* | 12.0 (3.0 – 23.4) |
| TNT/(μg/L) | 27.0 (5.0 – 650.0)** | 200.0 (5.0 – 2820.0)** | 61.0 (5.0 – 279.0)** | 611.0 (383.0 – 2700.0)**▲▲ | 92.0 (5.0 – 650.0)* | 0.0 (0.0 – 10.0) |
| ESR/(mm/h) | 19.0 (2.0 – 58.0)** | 15.0 (2.0 – 35.0)** | 11.0 (2.0 – 106.0)** | 13.0 (10.0 – 46.0)** | 13.5 (2.0 – 106.0)* | 2.0 (2.0 – 12.0) |
| CRP/(mg/L) | 4.9 (2.9 – 59.3)** | 2.9 (1.3 – 11.0) | 4.4 (1.3 – 81.5)** | 9.1 (0.6 – 9.2) | 4.0 (0.6 – 81.5)* | 0.9 (0.2 – 2.5) |
| SF/(mg/L) | 187.5 (30.6 – 578.2)** | 255.5 (30.62 – 1632.0)** | 463.1 (142.0 – 1433.0)** | 626.3 (503.7 – 1345.0)**▲▲ | 364.8 (30.6 – 1632.0)* | 67.4 (15.8 – 176.5) |
| IgG/(g/L) | 16.9 ± 4.4* | 11.1 ± 4.6* | 11.6 ± 4.9* | 14.0 ± 0.6 | 13.6 ± 4.9* | 11.3 ± 3.6 |
| IgA/(g/L) | 3.3 (2.0 – 5.0)** | 1.8 (1.0 – 2.6)** | 2.2 (0.9 – 3.4) | 2.3 (1.9 – 3.2) | 2.3 (0.6 – 6.6) | 2.0 (0.8 – 4.1) |
| IgM/(g/L) | 1.3 (0.8 – 1.7) | 1.1 (0.3 – 2.3) | 1.0 (0.7 – 1.3) | 1.5 (1.2 – 1.8)**▲▲ | 1.1 (0.8 – 1.5) | 1.0 (0.8 – 1.4) |
| ANA positive | 6 (60) | 4 (80) | 9 (82) | 2 (50) | 21 (70) | 0 |
Data are expressed as median (range), $\bar x \pm s$ or n(%). * P<0. 05, vs. health control; #P<0. 05, vs. DM; △P<0. 05, vs. PM; ▲P<0. 05, vs. OM. IM, idiopathic inflammatory myopathy; DM, dermatomyositis; PM, polymyositis; OM, overlap syndrome; IMNM, immune-mediated necrotizing myopathy; HC, health conrol; VAS, visual analog scale; MMT, manual muscle testing; MYOACT, myositis disease activity assessment visual analogue scale; MAT, myositis disease activity assessment tol; MI, myositis damage index; WC, whit lood cell; LY, lyhyte; Hb, hoglobin; ALT, alanine aminotransferase; AST, aspartate aminotransferae; LDH, lactate dehydrogenase; CK, creatine kinase; CK-MB, creaine kinase isoenzyme; TNT, roponin T; ESR, erythrocyte sedimentation rate; CRP, C-reactive protein; SF, serum feritin; IgG, immunoglobulin G; IgA, immunoglobulin A; IgM, immunoglobulin M; ANA, antinuclear antibody. |
2.3 各组血清中dsDNA、IL-1β和IL-18水平
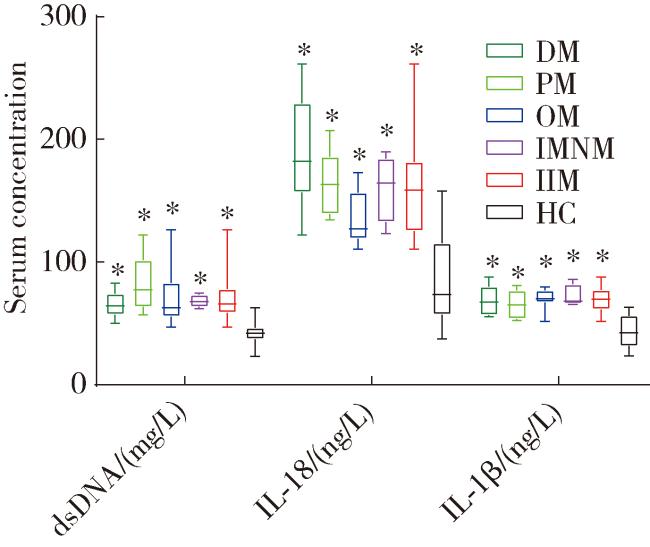
2.4 各组PBMC中mRNA相对表达
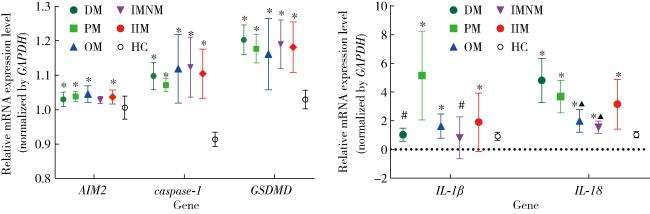
图2 健康对照组、IIM组及其各亚组(DM、PM、OM、IMNM)PBMC中mRNA的相对表达Figure 2 The relative expression of mRNA in PBMC of the health control group, IIM group and its subgroups (DM, PM, OM, IMNM) *P < 0.05, vs. HC; #P < 0.05, vs. PM; ▲P < 0.05, vs. DM. PBMC, peripheral blood mononuclear cell; Other abbreviations as in Table 1 and Table 2. |
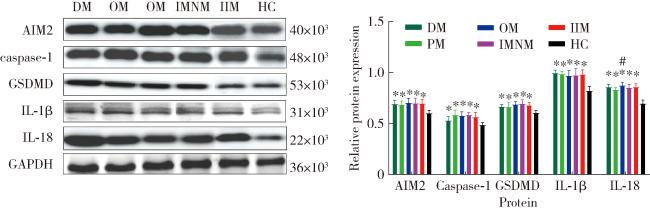
2.5 各组PBMC中的蛋白表达
2.6 相关性分析
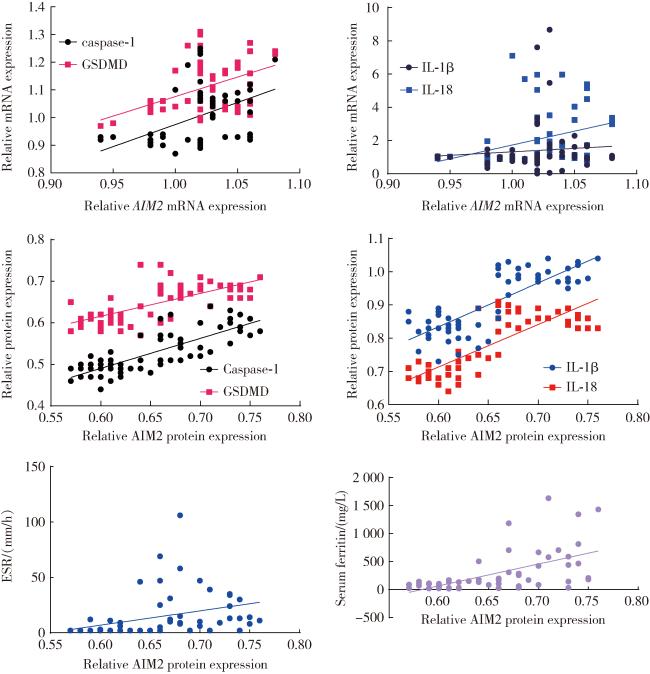
图4 IIM组和健康对照组PBMC中AIM2与mRNA、蛋白及血清炎性因子的相关性分析Figure 4 Correlation analysis of AIM2 with mRNA and protein in PBMC and serum inflammatory factors of IIM and health control groups PBMC, peripheral blood mononuclear cell; AIM2, absent in melanoma 2; GSDMD, gasdermin D; IL-1β, interleukin 1β; IL-18, interleukin 18. |