北京大学学报(医学版) ›› 2026, Vol. 58 ›› Issue (3): 496-502. doi: 10.19723/j.issn.1671-167X.2026.03.008

• 论著 • 上一篇    下一篇

2000—2021年全球204个国家直接与间接孕产妇死亡联合轨迹及演变特征

周一, 程钊, 冯星淋*()   

  1. 北京大学公共卫生学院卫生政策与管理学系, 北京 100191
  • 收稿日期:2026-02-24 出版日期:2026-06-18 发布日期:2026-04-09
  • 通讯作者: 冯星淋

Joint trajectories and evolution patterns of direct and indirect maternal mortality across 204 countries from 2000 to 2021

Yi ZHOU, Zhao CHENG, Xinglin FENG*()   

  1. Department of Health Policy and Management, Peking University School of Public Health, Beijing 100191, China
  • Received:2026-02-24 Online:2026-06-18 Published:2026-04-09
  • Contact: Xinglin FENG

RICH HTML


摘要:

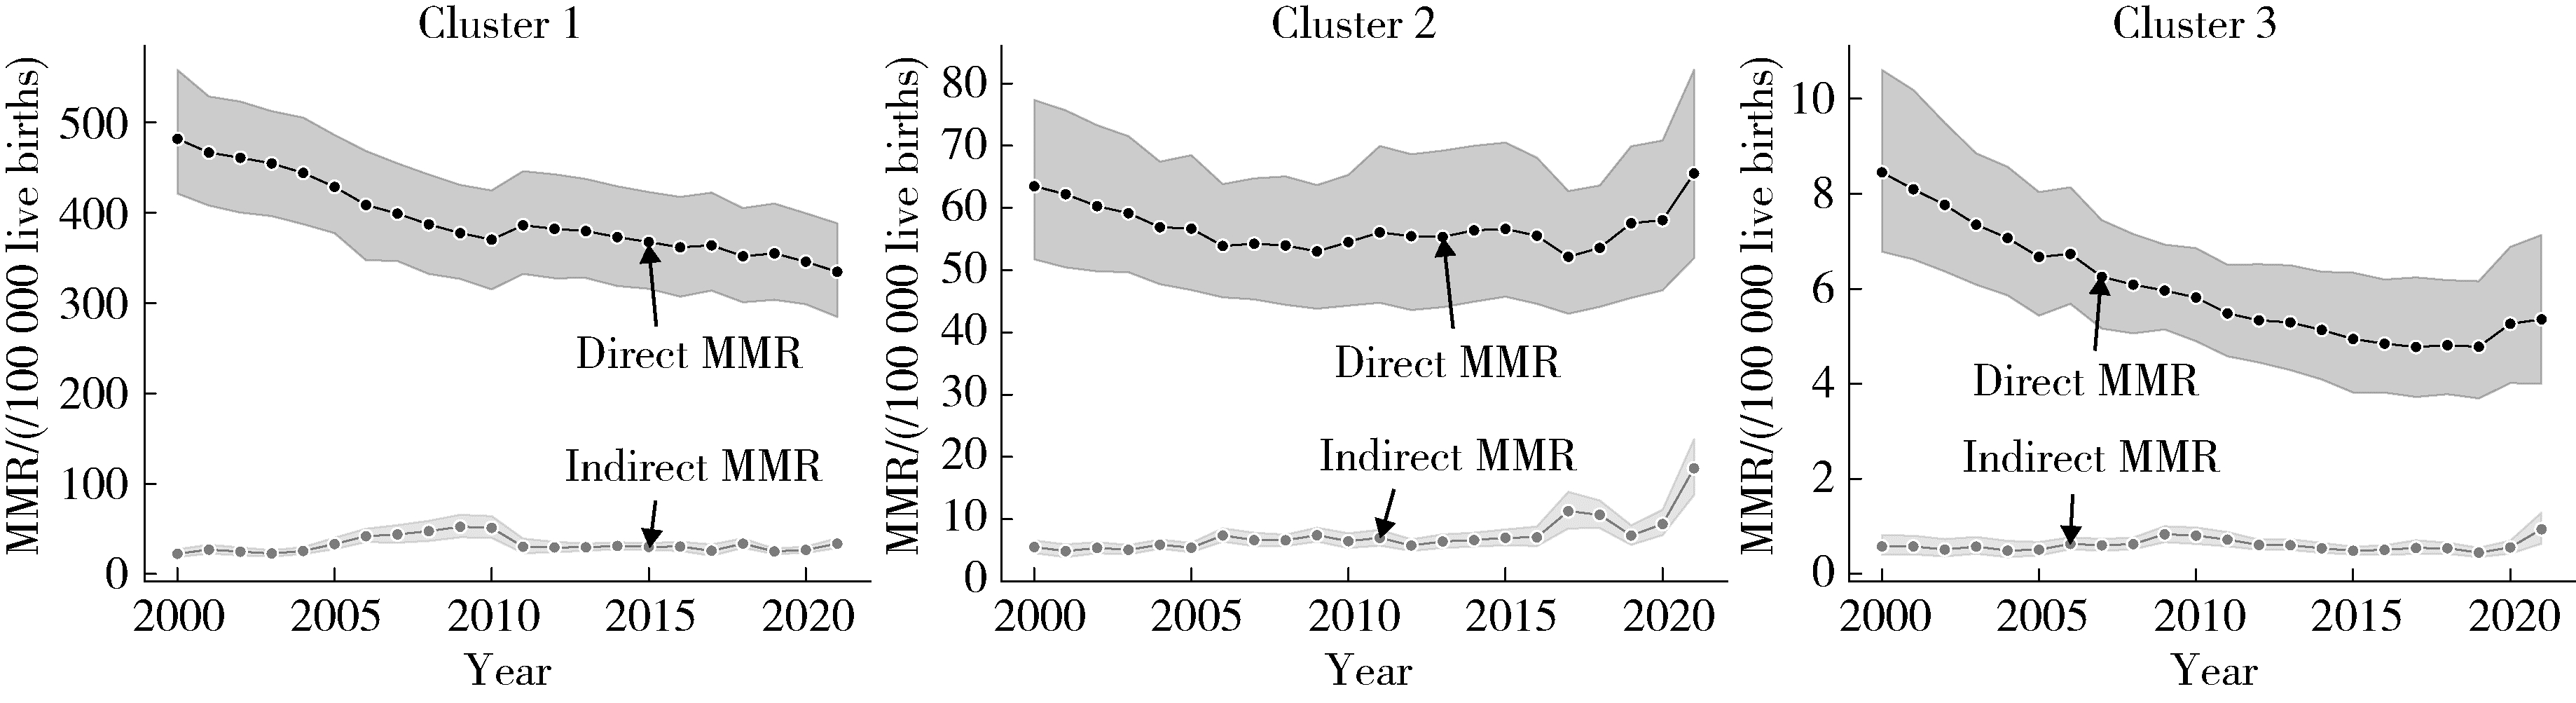
目的: 以直接与间接孕产妇死亡率(maternal mortality ratio,MMR)为联合结局,识别2000—2021年全球国家层面联合轨迹类型,并比较不同轨迹类型在跨千年发展目标期间(millennium development goals,MDG,2000—2015年)与可持续发展目标(sustainable development goals,SDG,2015—2021年)阶段变化特征及其卫生系统与制度环境差异。方法: 基于全球疾病负担(Global Burden Disease, GBD)研究数据库,纳入2000—2021年全球204个国家和地区15~49岁育龄妇女的孕产妇死亡指标。选取2000、2005、2010、2015和2021年国家直接产科死因与间接产科死因死亡率作为联合结局变量,取对数后采用纵向K-means聚类(k =2~6)识别联合轨迹类型,并依据Calinski-Harabasz (CH)指数确定最优类别数。在聚类分型基础上,构建分段线性混合效应模型(随机截距),以2015年为结点分别估计2000年基线截距及MDG、SDG两个阶段的变化斜率。进一步提取2021年至少4次产前检查覆盖率、满足现代化避孕的比例、剖宫产率、女性人类免疫缺陷病毒(human immunodeficiency virus,HIV)流行率、机构分娩率、专业助产人员覆盖率及流产合法性指数等指标,采用Kruskal-Wallis H检验比较不同轨迹类型国家在卫生服务覆盖、健康风险暴露与制度环境方面的差异。结果: 纵向聚类结果显示,当k=3时CH指数达到峰值(CH=342.63),最终将204个国家和地区划分为高负担组(n=66)、中等负担组(n=88)与低负担组(n=50)3类联合轨迹。2021年3组直接孕产妇死亡率分别为334.6/10万活产(95%CI:282.5~386.7)、65.6/10万活产(95%CI:50.4~80.7)和5.4/10万活产(95%CI:3.7~7.0);间接MMR分别为33.6/10万活产(95%CI:27.9~39.2)、18.2/10万活产(95%CI:13.5~22.9)和0.9/10万活产(95%CI:0.6~1.3)。分段混合效应模型显示,在MDG阶段(2000—2015年),3组直接孕产妇死亡率均呈显著下降趋势(斜率分别为-0.020、-0.016、-0.036,P均<0.001);进入SDG阶段(2015—2021年)后,直接孕产妇死亡率下降明显放缓并趋于停滞(斜率分别为-0.011、0.011、-0.006, P>0.05)。间接孕产妇死亡率方面,MDG阶段高负担组与中等负担组呈小幅上升(斜率分别为0.029与0.015,P<0.05),低负担组变化不显著(P>0.05);SDG阶段中等负担组间接孕产妇死亡率出现显著加速上升(斜率为0.121,95%CI:0.092~0.151,P<0.001),而高负担组与低负担组总体平稳(P>0.05)。卫生系统与制度环境指标比较显示,3组差异均具有统计学意义(P<0.001):高负担组至少4次产前检查覆盖率、机构分娩率与专业助产覆盖率相对较低,现代避孕方法需求满足率较低且女性HIV流行率较高;中等负担组机构分娩率与专业助产覆盖率接近全覆盖,但剖宫产率处于较高水平;低负担组多项指标处于较优水平且流产合法性指数更高。结论: 2000—2021年全球国家层面直接与间接孕产妇死亡存在显著分化的联合轨迹。MDG阶段直接死因下降显著,但SDG阶段普遍放缓并出现停滞;与此同时,中等负担国家间接死因在SDG阶段显著上升,提示在总体孕产妇死亡率相对稳定的情况下可能存在结构性风险累积。将直接与间接死因的联合轨迹纳入常规监测框架,有助于分阶段、分类型识别不同国家孕产妇死亡转型特征并确定干预重点。

关键词: 孕产妇死亡率, 直接产科死因, 间接产科死因, 联合轨迹, 纵向聚类

Abstract:

Objective: To identify joint trajectory patterns of direct and indirect maternal mortality ratios (MMR) at the country level from 2000 to 2021, and to compare phase-specific changes during the millennium development goals (MDG, 2000 to 2015) and the sustainable development goals (SDG, 2015 to 2021) periods, as well as differences in health system and policy environments across trajectory groups. Methods: Data on maternal mortality among women aged 15-49 years in 204 countries and territories from 2000 to 2021 were obtained from the Global Burden of Disease (GBD) Study. Direct cause MMR and indirect cause MMR at five time points (2000, 2005, 2010, 2015, and 2021) were jointly analyzed using longitudinal K-means clustering (k=2-6). The optimal number of clusters was determined by the Calinski-Harabasz (CH) index. Based on the clustering results, a piecewise linear mixed effects model with random intercepts was fitted with a knot in 2015 to estimate the baseline intercept in 2000 and period-specific slopes for the MDG and SDG phases. For 2021, health system and policy-related indicators, including antenatal care coverage (≥4 visits, ANC4), proportion of women with a demand for contraception that are using a modern method, cesarean section rate, female human immunodeficiency virus (HIV) prevalence, in facility delivery rate, skilled birth attendance, and an abortion legality index were compared across clusters using the Kruskal-Wallis H test. All tests were two-sided, and P < 0.05 was considered statistically significant. Results: The CH index peaked at k=3 (CH=342.63), classifying the 204 countries and territories into three joint trajectory clusters: high burden (n= 66), medium burden (n=88), and low burden (n=50). In 2021, direct MMR was 334.6 (95%CI: 282.5- 386.7), 65.6 (95%CI: 50.4-80.7), and 5.4 (95%CI: 3.7-7.0) per 100 000 live births in the high, medium, and low burden clusters, respectively; indirect MMR was 33.6 (95%CI: 27.9-39.2), 18.2 (95%CI: 13.5-22.9), and 0.9 (95%CI: 0.6-1.3) per 100 000 live births, respectively. The piecewise mixed effects model showed significant declines in direct MMR during the MDG period in all clusters (slopes: -0.020, -0.016, and -0.036; P < 0.001), whereas declines slowed and became non-significant during the SDG period (-0.011, 0.011, and -0.006; P > 0.05). For indirect MMR, modest increases were observed during the MDG period in the high and medium burden clusters (0.029 and 0.015; P < 0.05), with no significant change in the low burden cluster (P > 0.05). During the SDG period, indirect MMR increased markedly in the medium burden cluster (slope: 0.121; 95%CI: 0.092-0.151; P < 0.001), while remaining broadly stable in the high and low burden clusters (P > 0.05). Health system and policy indicators differed significantly across the clusters (P < 0.001): the high burden cluster showed lower ANC4 coverage, lower in facility delivery and skilled birth attendance, lower demand for contraception satisfied by modern methods, and higher female HIV prevalence; the medium burden cluster achieved near universal in facility delivery and skilled birth attendance but had a higher cesarean section rate; the low-burden cluster generally showed more favorable indicator profiles and a higher abortion legality index. Conclusion: Distinct joint trajectories of direct and indirect maternal mortality were observed globally from 2000 to 2021. While reductions in direct maternal mortality were substantial during the MDG era, progress broadly slowed and plateaued during the SDG era. Meanwhile, the pronounced rise in indirect maternal mortality in medium-burden countries during the SDG period suggests potential structural risk accumulation even when overall MMR appears stable. Incorporating joint direct-indirect trajectories into routine monitoring may facilitate stage and cluster specific prioritization of maternal health interventions.

Key words: Maternal mortality ratio, Direct maternal deaths, Indirect maternal deaths, Joint trajectory, Longitudinal clustering

中图分类号: 

  • R173

表1

2021年不同联合轨迹类型国家分死因孕产妇死亡率(每10万活产)"

Cause-specific category High burden (Cluster 1) Medium burden (Cluster 2) Low burden (Cluster 3)
Direct maternal deaths 334.6 (282.5, 386.7) 65.6 (50.4, 80.7) 5.4 (3.7, 7.0)
Ectopic pregnancy 23.9 (18.9, 29.0) 3.0 (2.0, 3.9) 0.2 (0.1, 0.2)
Maternal abortion and miscarriage 41.1 (32.5, 49.7) 4.2 (3.3, 5.1) 0.2 (0.1, 0.3)
Maternal obstructed labor and uterine rupture 17.7 (14.1, 21.4) 4.0 (2.2, 5.7) 0.2 (0.1, 0.3)
Maternal hemorrhage 74.3 (59.7, 88.8) 9.4 (6.4, 12.3) 0.8 (0.5, 1.0)
Maternal hypertensive disorders 71.4 (59.0, 83.9) 14.8 (11.5, 18.1) 1.0 (0.7, 1.2)
Maternal sepsis and other maternal infections 44.9 (31.9, 57.9) 4.3 (3.0, 5.5) 0.2 (0.1, 0.2)
Other direct maternal disorders 61.3 (50.5, 72.0) 26.0 (17.3, 34.7) 2.9 (1.5, 4.2)
Indirect maternal deaths 33.6 (27.9, 39.2) 18.2(13.5, 22.9) 0.9 (0.6, 1.3)

图1

2000—2021年不同联合轨迹类型国家直接与间接孕产妇死亡率的平均变化轨迹"

表2

基于分段混合效应模型的孕产妇死亡率截距与不同时期变化斜率估计值"

Trajectory cluster Intercept (2000 baseline) MDG slope (2000-2015) SDG slope (2015-2021)
Direct
  Cluster 1 5.979 (5.824, 6.135)*** -0.020 (-0.025, -0.016)*** -0.011 (-0.022, 0.001)
  Cluster 2 3.842 (3.666, 4.018)*** -0.016 (-0.024, -0.008)*** 0.011 (-0.008, 0.030)
  Cluster 3 1.934 (1.769, 2.100)*** -0.036 (-0.043, -0.029)*** -0.006 (-0.023, 0.012)
Indirect
  Cluster 1 2.958 (2.781, 3.135)*** 0.029 (0.014, 0.044)*** -0.011 (-0.048, 0.026)
  Cluster 2 1.346 (1.164, 1.528)*** 0.015 (0.003, 0.028)* 0.121 (0.092, 0.151)***
  Cluster 3 -1.009 (-1.293, -0.726)*** 0.009 (-0.008, 0.026) 0.006 (-0.035, 0.047)

表3

2021年不同轨迹类型国家孕产妇卫生资源比较"

Variable High burden (Cluster 1) Medium burden (Cluster 2) Low burden (Cluster 3) Kruskal-Wallis H
ANC(≥4 visits)/% 63.25 (50.05, 81.66) 93.60 (86.34, 96.34) 99.18 (97.93, 99.67) 126.69***
Demand for contraception using a modern method/% 52.73 (39.85, 73.38) 74.94 (57.49, 84.60) 89.78 (71.21, 92.98) 54.25***
Cesarean section rate/% 10.66 (6.02, 20.72) 32.03 (21.05, 42.43) 30.72 (22.00, 36.40) 63.36***
HIV prevalence in women/% 1.22 (0.16, 3.60) 0.13 (0.05, 0.29) 0.04 (0.01, 0.12) 59.44***
In-facility delivery rate/% 85.95 (64.28, 92.79) 99.35 (96.99, 99.76) 99.82 (99.61, 99.91) 105.19***
Skilled birth attendance/% 87.13 (70.59, 94.23) 99.56 (98.65, 99.83) 99.80 (99.49, 99.90) 102.54***
Abortion legality index 50.72 (40.00, 65.00) 60.00 (40.00, 90.00) 85.00 (70.00, 90.00) 35.50***
1
World Health Organization, UNICEF, UNFPA, et al. Trends in maternal mortality 2000 to 2020: Estimates by WHO, UNICEF, UNFPA, World Bank Group and UNDESA/Population Division[M/OL]. Geneva: World Health Organization, 2023[2026-02-01]. https://iris.who.int/server/api/core/bitstreams/c3957b94-cdd5-47d7-85f8-6202be229f8e/content.
2
World Health Organization. SDG target 3.1 maternal mortality[EB/OL]. [2026-02-01]. https://www.who.int/data/gho/data/themes/topics/sdg-target-3-1-maternal-mortality.
3
World Health Organization. Millennium development goals (MDG)[EB/OL]. [2026-02-01]. https://www.who.int/zh/news-room/fact-sheets/detail/millennium-development-goals-%28mdgs%29.
4
Souza JP , Tunçalp , Vogel JP , et al. Obstetric transition: The pathway towards ending preventable maternal deaths[J]. BJOG, 2014, 121 (Suppl 1): 1- 4.
5
Souza JP , Day LT , Rezende-Gomes AC , et al. A global analysis of the determinants of maternal health and transitions in maternal mortality[J]. Lancet Glob Health, 2024, 12 (2): e306- e316.

doi: 10.1016/S2214-109X(23)00468-0
6
Cresswell JA , Alexander M , Chong MYC , et al. Global and regional causes of maternal deaths 2009-20: A WHO systematic analysis[J]. Lancet Glob Health, 2025, 13 (4): e626- e634.

doi: 10.1016/S2214-109X(24)00560-6
7
Feng J , Huang J , Wu Q , et al. Maternal mortality ratios in Southeast Asia (1990-2021): Trends, disparities, and projections through 2050 based on the global burden of disease 2021, with reference to SDG 3.1[J]. BMC Pregnancy Childbirth, 2025, 25 (1): 1264.

doi: 10.1186/s12884-025-08443-w
8
Sepanlou SG , Rezaei Aliabadi H , Malekzadeh R , et al. Levels and trends of maternal mortality and morbidity by cause in north Africa and middle east, 1990 to 2019: An analysis for the global burden of disease study 2019[J]. Arch Iran Med, 2022, 25 (10): 666- 675.

doi: 10.34172/aim.2022.105
9
GBD 2023 Causes of Death Collaborators . Global burden of 292 causes of death in 204 countries and territories and 660 subnational locations, 1990-2023: A systematic analysis for the Global Burden of Disease Study 2023[J]. Lancet, 2025, 406 (10513): 1811- 1872.
10
Hay SI , Ong KL , Santomauro DF , et al. Burden of 375 diseases and injuries, risk-attributable burden of 88 risk factors, and healthy life expectancy in 204 countries and territories, including 660 subnational locations, 1990-2023: A systematic analysis for the Global Burden of Disease Study 2023[J]. Lancet, 2025, 406 (10513): 1873- 1922.
11
Global Burden of Disease Collaborative Network. Global Burden of Disease Study 2023 (GBD 2023) Covariates 1980-2023[EB/OL]. [2026-02-15]. https://doi.org/10.6069/b09t-1r53.
12
Kruk ME , Gage AD , Joseph NT , et al. Mortality due to low-quality health systems in the universal health coverage era: A systematic analysis of amenable deaths in 137 countries[J]. Lancet, 2018, 392 (10160): 2203- 2212.

doi: 10.1016/S0140-6736(18)31668-4
13
Marthias T , Anindya K , Saputri NS , et al. Effective coverage for reproductive, maternal, neonatal and newborn health: An analysis of geographical and socioeconomic inequalities in 39 low- and middle-income countries[J]. BMJ Glob Health, 2025, 10 (2): e016549.

doi: 10.1136/bmjgh-2024-016549
14
Priebe J , Amuasi J , Dartanto T , et al. Factors associated with skilled birth attendance in 37 low-income and middle-income countries: A secondary analysis of nationally representative, individual-level data[J]. Lancet Glob Health, 2024, 12 (7): e1104- e1110.

doi: 10.1016/S2214-109X(24)00145-1
15
Say L , Chou D , Gemmill A , et al. Global causes of maternal death: A WHO systematic analysis[J]. Lancet Glob Health, 2014, 2 (6): e323- e333.
16
Chaves SC , Cecatti JG , Carroli G , et al. Obstetric transition in the World Health Organization multicountry survey on maternal and newborn health: Exploring pathways for maternal mortality reduction[J]. Rev Panam Salud Publica, 2015, 37 (4/5): 203- 210.
17
Cirelli JF , Surita FG , Costa ML , et al. The burden of indirect causes of maternal morbidity and mortality in the process of obstetric transition: A cross-sectional multicenter study[J]. Rev Bras Ginecol Obstet, 2018, 40 (3): 106- 114.
18
Banke-Thomas A , Wong KLM , Olubodun T , et al. Geographical accessibility to functional emergency obstetric care facilities in urban Nigeria using closer-to-reality travel time estimates: A population-based spatial analysis[J]. Lancet Glob Health, 2024, 12 (5): e848- e858.
19
Ferede Gebremedhin A , Dawson A , Hayen A . Evaluations of effective coverage of maternal and child health services: A systematic review[J]. Health Policy Plan, 2022, 37 (7): 895- 914.
20
Boerma T , Campbell OMR , Amouzou A , et al. Maternal mortality, stillbirths, and neonatal mortality: A transition model based on analyses of 151 countries[J]. Lancet Glob Health, 2023, 11 (7): e1024- e1031.
21
Langlois EV , Reid A , Khosla R . Mothers deserve better: Evidence-based strategies to address maternal mortality[J]. Lancet Glob Health, 2025, 13 (5): e797- e798.
22
Nove A , Friberg IK , de Bernis L , et al. Potential impact of midwives in preventing and reducing maternal and neonatal mortality and stillbirths: A lives saved tool modelling study[J]. Lancet Glob Health, 2021, 9 (1): e24- e32.
23
GBD 2019 Risk Factors Collaborators . Global burden of 87 risk factors in 204 countries and territories, 1990-2019: A systematic analysis for the Global Burden of Disease Study 2019[J]. Lancet, 2020, 396 (10258): 1223- 1249.
[1] 王晓伟,穆英超,郭振宇,周玉博,张勇,李宏田,刘建蒙. 中国山东某县1951年以来出生女性初潮年龄与绝经年龄长期趋势[J]. 北京大学学报(医学版), 2023, 55(3): 502-510.
[2] 何伟,杨思雯,陈娟,朱晓俊,陈志忠,马文军. 275 nm和310 nm紫外线对去卵巢骨质疏松大鼠骨代谢的影响[J]. 北京大学学报(医学版), 2022, 54(2): 236-243.
[3] 宋沁峰,李宏田,杨静,原鹏波,程志浩,刘建蒙,赵扬玉. 双胎妊娠孕早期甲状腺功能及其与早产的关联性[J]. 北京大学学报(医学版), 2021, 53(3): 473-478.
[4] 李雪莹, 毛康娜, 弭小艺, 高玲玲, 杨晓, 陶惠芬, 张迎武, 陈敬, 王行, 沈丽娟, 袁洁铃, 苗淼, 周虹. 育儿胜任感量表在学龄前儿童母亲中应用的信效度评价[J]. 北京大学学报(医学版), 2021, 53(3): 479-484.
Viewed
Full text


Abstract

Cited

  Shared   
  Discussed   
No Suggested Reading articles found!