北京大学学报(医学版) ›› 2025, Vol. 57 ›› Issue (6): 1136-1144. doi: 10.19723/j.issn.1671-167X.2025.06.018

• 论著 • 上一篇    下一篇

中国老年人社会经济地位与视力障碍的相关性

魏粤晖, 简伟研*()   

  1. 北京大学公共卫生学院卫生政策与管理学系, 北京 100191
  • 收稿日期:2025-02-09 出版日期:2025-12-18 发布日期:2025-09-24
  • 通讯作者: 简伟研
  • 基金资助:
    国家社会科学基金重大项目(22&ZD143)

Association between socioeconomic status and vision impairment among Chinese elderly

Yuehui WEI, Weiyan JIAN*()   

  1. Department of Health Policy and Management, Peking University School of Public Health, Beijing 100191, China
  • Received:2025-02-09 Online:2025-12-18 Published:2025-09-24
  • Contact: Weiyan JIAN
  • Supported by:
    the National Social Science Fund of China (Major Project)(22&ZD143)

RICH HTML


摘要:

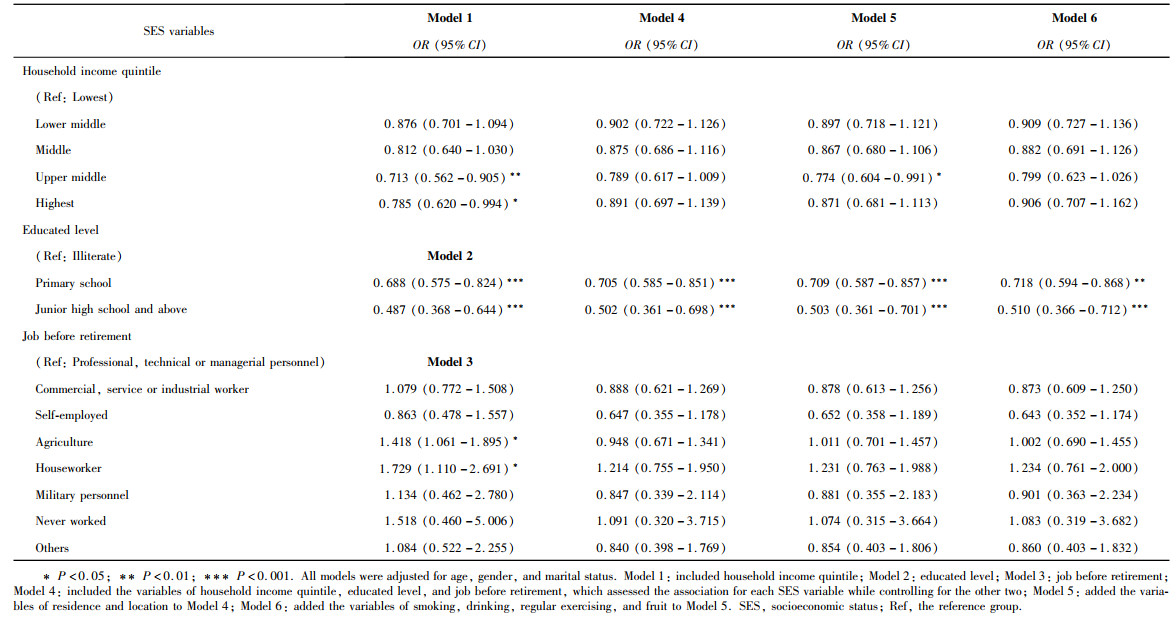
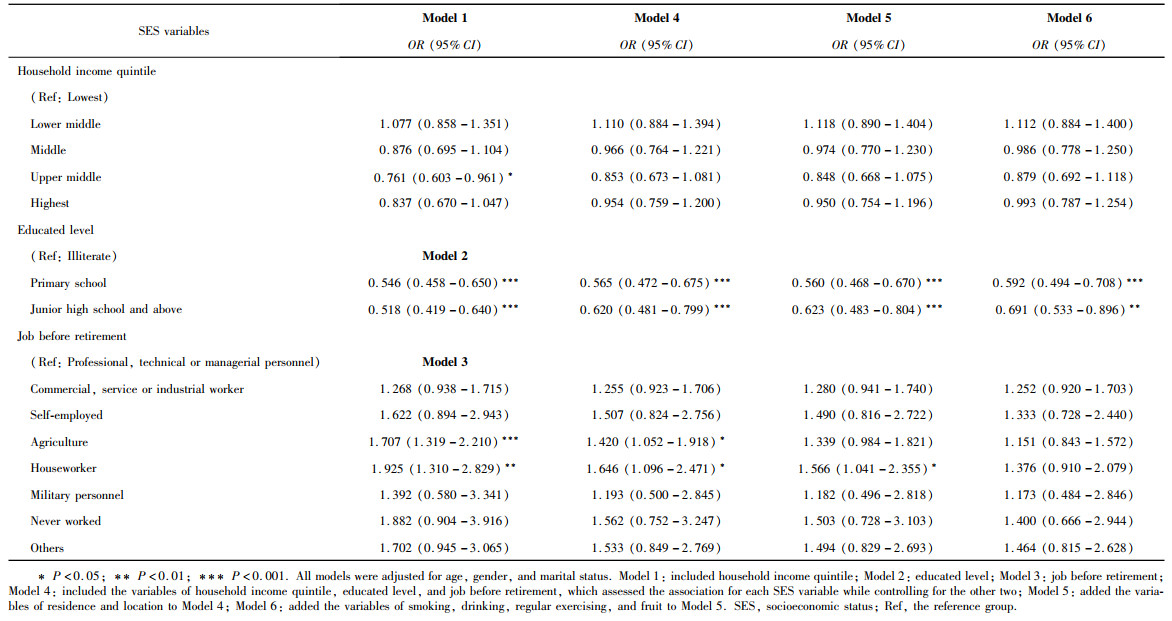
目的: 分析中国65岁及以上老年人的社会经济地位与视力障碍的相关性, 并比较2008-2018年的变化情况。方法: 使用2008年和2018年"中国老年人健康长寿影响因素调查"的横断面数据, 分别纳入12970名和9702名受访者。构建Logistic回归模型, 采用逐步进入法依次加入控制变量, 分析2008年和2018年中国老年人家庭收入、受教育程度、退休前职业与视力障碍之间的关联。结果: 2008年中国65岁及以上老年人视力障碍患病率为16.92%(95%CI: 15.91%~17.98%), 2018年该患病率上升至18.45%(95%CI: 17.41%~19.53%)。与低收入群体相比, 2008年高收入和中高收入群体患视力障碍的风险较低, 2018年仅中高收入群体患视力障碍的风险较低(OR=0.761, 95%CI: 0.603~0.961), 且差距缩小。与文盲相比, 2008年小学、初中及以上学历群体患视力障碍的风险较低, 2018年小学组与文盲组的差距增大, 初中及以上组与文盲组、小学组的差距缩小, 控制其他因素后, 初中及以上组的患病风险高于小学组(OR=0.691, 95%CI: 0.533~0.896;OR=0.592, 95%CI: 0.494~0.708)。与退休前从事专业技术或管理类职业群体相比, 2008年从事农业、家务劳动群体患视力障碍的风险较高, 2018年这一现象依旧存在(OR=1.707, 95%CI: 1.319~2.210;OR=1.925, 95%CI: 1.310~2.829), 且两个群体间的差距有所增大。结论: 中国老年人视力障碍的患病率在2008-2018年间有所上升, 家庭收入、受教育程度、退休前职业与视力障碍之间存在关联。2008-2018年, 不同家庭收入群体患视力障碍的风险差距缩小; 不同受教育程度群体的患病风险差距整体缩小, 但小学学历群体与文盲群体的差距增大; 退休前各职业类型群体的患病风险差距增大。

关键词: 视力障碍, 社会经济地位, 老年人, 相关性研究

Abstract:

Objective: To assess the association between socioeconomic status and vision impairment (Ⅵ) among Chinese elderly aged 65 years and above, and explore its comparison and contrast from 2008 to 2018. Methods: Using the 2008 and 2018 waves of cross-sectional data from the Chinese Longitudinal Healthy Longevity Survey (CLHLS), which included 12970 and 9702 participants, respectively. Logistic regression models with a stepwise forward approach were employed to assess the association between the household income, educated level, job before retirement and Ⅵ. Results: In 2008, the prevalence of Ⅵ among the elderly aged 65 years and above in China was 16.92% (95%CI: 15.91%-17.98%), which increased to 18.45% (95%CI: 17.41%-19.53%) in 2018. In terms of household income, the highest and upper middle income groups had lower odds of Ⅵ compared with the lowest one in 2008. By 2018, only the upper middle had lower odds (OR=0.761, 95%CI: 0.603-0.961), with its disparity narrowing compared with 2008. For educated level, in 2008, individuals with primary school education, and those with junior high school education or above had lower odds of Ⅵ compared with illiterate individuals. By 2018, the disparity in Ⅵ between the illiterate individuals and those with primary school education widened, while the gap between the illiterate ones and those with junior high school education or above decreased. In addition, after controlling for other factors, the odds of Ⅵ for the individuals educated by junior high school and above was higher than for those educated by primary school (OR=0.691, 95%CI: 0.533-0.896; OR=0.592, 95%CI: 0.494-0.708). Regarding job before retirement, in 2008, compared with the professional, technical or managerial personnel, those engaged in agriculture or domestic work had higher odds of Ⅵ. In 2018, this disparity persisted (OR=1.707, 95%CI: 1.319-2.210; OR=1.925, 95%CI: 1.310-2.829), with the gaps widening compared with the reference group. Conclusion: The prevalence of Ⅵ among Chinese elderly increased from 2008 to 2018, with socioeconomic status, specifically household income, educated level, and job before retirement, demonstrating associations with Ⅵ. To be specific, the gap in the odds of Ⅵ across household income strata decreased from 2008 to 2018; disparities among different educated levels generally diminished, while the gap between illiterate individuals and ones educated by primary school widened; and job-before-retirement groups exhibited expanding disparities over time.

Key words: Vision disorders, Socioeconomic status, Aged, Correlational research

中图分类号: 

  • R197.1

表1

研究对象的基本特征"

Variables Year 2008 (n=12 970), n (%) Year 2018 (n=9 702), n (%)
Age/years
  65-74 2 485 (19.16) 2 392 (24.65)
  75-84 2 576 (19.86) 2 401 (24.75)
  85 and above 7 909 (60.98) 4 909 (50.60)
Gender
  Female 7 340 (56.59) 5 350 (55.14)
  Male 5 630 (43.41) 4 352 (44.86)
Marital status
  Others 8 255 (63.65) 5 167 (53.26)
  Currently married 4 715 (36.35) 4 535 (46.74)
Household income quintile
  Lowest 2 857 (22.03) 1 970 (20.31)
  Lower middle 2 926 (22.56) 1 973 (20.34)
  Middle 2 442 (18.83) 1 861 (19.18)
  Upper middle 2 472 (19.06) 2 000 (20.61)
  Highest 2 273 (17.53) 1 898 (19.56)
Educated level
  Illiterate 8 024 (61.87) 4 678 (48.22)
  Primary school 3 653 (28.16) 3 140 (32.36)
  Junior high school and above 1 293 (9.97) 1 884 (19.42)
Job before retirement
  Professional, technical or managerial personnel 956 (7.37) 1 084 (11.17)
  Commercial, service or industrial worker 1 734 (13.37) 1 403 (14.46)
  Self-employed 249 (1.92) 181 (1.87)
  Agriculture 8 592 (66.25) 5 980 (61.64)
  Houseworker 1 075 (8.29) 655 (6.75)
  Military personnel 85 (0.66) 90 (0.93)
  Never worked 86 (0.66) 143 (1.47)
  Others 193 (1.49) 166 (1.71)
Residence
  Rural 7 771 (59.92) 4 173 (43.01)
  Urban 5 199 (40.08) 5 529 (56.99)
Location
  East 5 202 (40.11) 4 554 (46.94)
  Middle 3 200 (24.67) 2 166 (22.33)
  West 3 510 (27.06) 2 514 (25.91)
  North-east 1 058 (8.16) 468 (4.82)
Smoking
  Never 8 610 (66.38) 6 688 (68.93)
  Past or current 4 360 (33.62) 3 014 (31.07)
Drinking
  Never 8 953 (69.03) 7 080 (72.97)
  Past or current 4 017 (30.97) 2 622 (27.03)
Regular exercising
  Never 7 812 (60.23) 5 919 (61.01)
  Past or current 5 158 (39.77) 3 783 (38.99)
Fruit
  Not often 7 704 (59.40) 5 222 (53.82)
  Often 5 266 (40.60) 4 480 (46.18)

表2

2008—2018年中国老年人按社会经济地位、城乡和地区分组的视力障碍患病率"

Variables Year 2008, n (%)a Year 2018, n (%)a
Household income quintile
  Lowest 1 237 (19.87) 774 (20.59)
  Lower middle 1 218 (17.87) 807 (20.73)
  Middle 981 (16.37) 654 (17.45)
  Upper middle 881 (14.73) 728 (15.73)
  Highest 802 (15.70) 611 (17.75)
F=2.924b, P=0.020 F=3.218b, P=0.012
Educated level
  Illiterate 3 855 (22.99) 2 388 (28.49)
  Primary school 1 029 (14.24) 816 (14.82)
  Junior high school and above 235 (9.53) 370 (13.47)
F=46.582b, P < 0.001 F=69.762b, P < 0.001
Job before retirement
  Professional, technical or managerial personnel 215 (11.69) 245 (12.37)
  Commercial, service or industrial worker 499 (13.70) 414 (15.33)
  Self-employed 88 (12.46) 60 (17.14)
  Agriculture 3 574 (18.61) 2 380 (19.94)
  Houseworker 606 (26.24) 321 (23.44)
  Military personnel 23 (13.62) 25 (17.51)
  Never worked 45 (21.32) 78 (22.85)
  Others 69 (13.84) 51 (18.23)
F=5.804b, P < 0.001 F=4.356b, P < 0.001
Residence
  Rural 3 142 (17.30) 1 631 (19.63)
  Urban 1 977 (16.50) 1 943 (17.29)
F=0.556b, P=0.456 F=4.789b, P=0.029
Location
  East 2 048 (17.02) 1 639 (17.24)
  Middle 1 291 (17.83) 830 (18.77)
  West 1 394 (16.97) 972 (20.76)
  North-east 386 (14.10) 133 (16.61)
F=1.086b, P=0.353 F=2.531b, P=0.055

表3

2008年中国老年人视力障碍的Logistic回归分析(n=12 970)"

表4

2018年中国老年人视力障碍的Logistic回归分析(n=9 702)"

1
Swenor BK , Ehrlich JR . Ageing and vision loss: Looking to the future[J]. Lancet Glob Health, 2021, 9 (4): e385- e386.

doi: 10.1016/S2214-109X(21)00031-0
2
Cao GY , Chen ZS , Yao SS , et al. The association between vision impairment and cognitive outcomes in older adults: A systematic review and meta-analysis[J]. Aging Ment Health, 2023, 27 (2): 350- 356.

doi: 10.1080/13607863.2022.2077303
3
Ehrlich JR , Ramke J , MacLeod D , et al. Association between vision impairment and mortality: A systematic review and meta-analysis[J]. Lancet Glob Health, 2021, 9 (4): e418- e430.

doi: 10.1016/S2214-109X(20)30549-0
4
VanNasdale DA , Jones-Jordan LA , Hurley MS , et al. Association between vision impairment and physical quality of life assessed using national surveillance data[J]. Optom Vis Sci, 2021, 98 (9): 1063- 1069.

doi: 10.1097/OPX.0000000000001773
5
Zhang T , Jiang W , Song X , et al. The association between visual impairment and the risk of mortality: A meta-analysis of prospective studies[J]. J Epidemiol Community Health, 2016, 70 (8): 836- 842.

doi: 10.1136/jech-2016-207331
6
World Health Organization. World report on vision. Geneva: World Health Organization [EB/OL]. (2019-12-08) [2025-01-26]. https://www.who.int/publications/i/item/9789241516570.
7
GBD 2017 DALYs and HALE Collaborators . Global, regional, and national disability-adjusted life-years (DALYs) for 359 diseases and injuries and healthy life expectancy (HALE) for 195 countries and territories, 1990-2017: A systematic analysis for the Global Burden of Disease Study 2017[J]. Lancet, 2018, 392 (10159): 1859- 1922.

doi: 10.1016/S0140-6736(18)32335-3
8
Thapa R , Bajimaya S , Paudyal G , et al. Prevalence and causes of low vision and blindness in an elderly population in Nepal: The Bhaktapur retina study[J]. BMC Ophthalmol, 2018, 18 (1): 42.

doi: 10.1186/s12886-018-0710-9
9
国家卫生健康委. 国家卫生健康委关于印发"十四五"全国眼健康规划(2021—2025年)的通知[EB/OL]. (2022-01-04) [2025-01-26]. https://www.gov.cn/zhengce/zhengceku/2022-01/17/content_5668951.htm.
10
Luo Y , Zhang Q , Han L , et al. Trends in the prevalence of vision impairment among the oldest-old Chinese population from 1998 to 2018[J]. J Glob Health, 2022, 12, 11006.

doi: 10.7189/jogh.12.11006
11
Ulldemolins AR , Lansingh VC , Valencia LG , et al. Social inequalities in blindness and visual impairment: A review of social determinants[J]. Indian J Ophthalmol, 2012, 60 (5): 368- 375.

doi: 10.4103/0301-4738.100529
12
Cumberland PM , Rahi JS , Biobank Eye and Vision Consortium UK . Visual function, social position, and health and life chances: The UK biobank study[J]. JAMA Ophthalmol, 2016, 134 (9): 959- 966.
13
Zhu RR , Shi J , Yang M , et al. Prevalences and causes of vision impairment in elderly Chinese: A socioeconomic perspective of a comparative report nested in Jiangsu eye study[J]. Int J Ophthalmol, 2016, 9 (7): 1051- 1056.
14
Pan CW , Qian DJ , Sun HP , et al. Visual impairment among older adults in a rural community in Eastern China[J]. J Ophthalmol, 2016, 2016, 9620542.
15
Tang Y , Wang X , Wang J , et al. Prevalence and causes of visual impairment in a Chinese adult population: The Taizhou eye study[J]. Ophthalmology, 2015, 122 (7): 1480- 1488.

doi: 10.1016/j.ophtha.2015.03.022
16
Yan X , Chen L , Yan H . Socio-economic status, visual impairment and the mediating role of lifestyles in developed rural areas of China[J]. PLoS One, 2019, 14 (4): e0215329.

doi: 10.1371/journal.pone.0215329
17
Zeng Y , Feng Q , Hesketh T , et al. Survival, disabilities in activities of daily living, and physical and cognitive functioning among the oldest-old in China: A cohort study[J]. Lancet, 2017, 389 (10079): 1619- 1629.

doi: 10.1016/S0140-6736(17)30548-2
18
北京大学健康老龄与发展研究中心. 中国老年健康影响因素跟踪调查(CLHLS)-追踪数据(1998-2018) [EB/OL]. (2020-04-03) [2025-02-06]. https://doi.org/10.18170/DVN/WBO7LK.
19
Xiao Z , Vaupel JW , Zeng Y . The healthy longevity survey and the active life expectancy of the oldest old in China[J]. Population, 2001, 56 (HS1): 95- 116.

doi: 10.3917/popu.p2001.13n1.0116
20
Cao G , Wang K , Han L , et al. Visual trajectories and risk of physical and cognitive impairment among older Chinese adults[J]. J Am Geriatr Soc, 2021, 69 (10): 2877- 2887.

doi: 10.1111/jgs.17311
21
Vargas V , Radner W , Allan BD , et al. Methods for the study of near, intermediate vision, and accommodation: An overview of subjective and objective approaches[J]. Surv Ophthalmol, 2019, 64 (1): 90- 100.

doi: 10.1016/j.survophthal.2018.08.003
22
Daly MC , Duncan GJ , McDonough P , et al. Optimal indicators of socioeconomic status for health research[J]. Am J Public Health, 2002, 92 (7): 1151- 1157.

doi: 10.2105/AJPH.92.7.1151
23
Feng Y , Jia S , Zhao W , et al. Independent and joint associations of socioeconomic status and lifestyle behaviors with cognitive impairment among elderly Chinese population[J]. J Prev Alzheimers Dis, 2024, 11 (5): 1513- 1522.

doi: 10.14283/jpad.2024.127
24
Chen H , Hu H . The relationship and mechanism between education and functional health status transition among older persons in China[J]. BMC Geriatr, 2018, 18 (1): 89.

doi: 10.1186/s12877-018-0785-4
25
Gao M , Kuang W , Qiu P , et al. The time trends of cognitive impairment incidence among older Chinese people in the community: Based on the CLHLS cohorts from 1998 to 2014[J]. Age Ageing, 2017, 46 (5): 787- 793.

doi: 10.1093/ageing/afx038
26
Xu T , Wang B , Liu H , et al. Prevalence and causes of vision loss in China from 1990 to 2019: Findings from the Global Burden of Disease Study 2019[J]. Lancet Public Health, 2020, 5 (12): e682- e691.

doi: 10.1016/S2468-2667(20)30254-1
27
Whillans J , Nazroo J . Social inequality and visual impairment in older people[J]. J Gerontol B Psychol Sci Soc Sci, 2018, 73 (3): 532- 542.
28
Elam AR , Tseng VL , Rodriguez TM , et al. Disparities in vision health and eye care[J]. Ophthalmology, 2022, 129 (10): e89- e113.

doi: 10.1016/j.ophtha.2022.07.010
29
Emamian MH , Zeraati H , Majdzadeh R , et al. Economic inequa-lity in presenting near vision acuity in a middle-aged population: A Blinder-Oaxaca decomposition[J]. Br J Ophthalmol, 2013, 97 (9): 1100- 1103.

doi: 10.1136/bjophthalmol-2013-303249
30
Hemmerich C , Jones G , Staggs J , et al. Inequities and research gaps in ophthalmology: A scoping review[J]. JAMA Ophthalmol, 2023, 141 (1): 63- 70.

doi: 10.1001/jamaophthalmol.2022.5237
31
赵月, 王爱平. 老年人视力障碍影响因素的研究进展[J]. 中国实用护理杂志, 2021, 37 (13): 1032- 1036.
32
熊晓菁. 重庆市农村地区土家族老年人群视力障碍患病率及原因分析[D]. 重庆: 重庆医科大学, 2018.
33
Grossman M . The correlation between health and schooling[M]. New York: Columbia University Press, 2017: 128- 189.
34
张文宏, 陈晓冰. 教育对个体健康水平的影响[J]. 山东社会科学, 2020 (7): 84- 93.
35
吴玮. 教育对健康的影响分析[D]. 杭州: 浙江大学, 2009.
36
资德平. 教育对健康的影响分析[D]. 长沙: 湖南大学, 2016.
37
成前, 王鸿儒, 倪志良. 教育水平、个体健康与公共财政支持[J]. 江西财经大学学报, 2016 (5): 24- 32.
38
靳永爱, 胡文波, 冯阳. 数字时代的互联网使用与中老年人生活——中国老年群体数字鸿沟与数字融入调查主要数据结果分析[J]. 人口研究, 2024, 48 (1): 40- 55.
39
中国互联网络信息中心. 第43次《中国互联网络发展状况统计报告》 [EB/OL]. (2019-02-28) [2025-02-06]. https://www.cnnic.cn/n4/2022/0401/c88-838.html.
40
中国乡村发展基金会. 光明工程白内障复明项目[EB/OL]. (2022) [2025-02-06]. https://www.cfpa.org.cn/project/GNProjectDetail.aspx?id=134.
41
马震, 严丽萍, 魏南方. 不同职业特征人群健康素养现状调查[J]. 中国预防医学杂志, 2012, 13 (5): 380- 383.
[1] 刘园梅, 傅义程, 郝靖欣, 张福春, 刘慧琳. 老年髋部骨折患者住院期间发生术后心力衰竭的列线图预测模型的构建及验证[J]. 北京大学学报(医学版), 2024, 56(5): 874-883.
[2] 张浩宇,石逸雯,潘薇,刘爱萍,孙昕霙,李曼,张旭熙. 基于不同失能水平的老年人照料需求的影响因素[J]. 北京大学学报(医学版), 2024, 56(3): 431-440.
[3] 靖婷,江华,李婷,申倩倩,叶兰,曾银丹,梁文欣,冯罡,司徒文佑,张玉梅. 中国西部5城市中老年人血清25羟基维生素D与握力的相关性[J]. 北京大学学报(医学版), 2024, 56(3): 448-455.
[4] 林郁婷,王华丽,田宇,巩俐彤,常春. 北京市老年人认知功能的影响因素[J]. 北京大学学报(医学版), 2024, 56(3): 456-461.
[5] 汤华萌,袁典琪,王明星,杨晗冰,郭超. 数字融入和健康生活方式对社会经济状况与老年人抑郁关系的序列中介作用[J]. 北京大学学报(医学版), 2024, 56(2): 230-238.
[6] 刘慧丽,吕彦函,王晓晓,李民. 老年患者腹腔镜泌尿系肿瘤根治术后慢性疼痛的影响因素[J]. 北京大学学报(医学版), 2023, 55(5): 851-856.
[7] 祝春素,连至炜,崔一民. 中国中老年人抑郁和慢性病的关联[J]. 北京大学学报(医学版), 2023, 55(4): 606-611.
[8] 刘光奇,庞元捷,吴疆,吕敏,于孟轲,李雨橦,黄旸木. 2013—2019年流感季北京市住院老年人流感疫苗接种趋势分析[J]. 北京大学学报(医学版), 2022, 54(3): 505-510.
[9] 刘杰,郭超. 正/负性情绪对中国老年人死亡风险影响的前瞻性队列研究[J]. 北京大学学报(医学版), 2022, 54(2): 255-260.
[10] 李佳,徐钰,王优雅,高占成. 老年流感肺炎的临床特征及D-二聚体与疾病严重程度的相关性[J]. 北京大学学报(医学版), 2022, 54(1): 153-160.
[11] 敖明昕,李学民,于媛媛,时会娟,黄红拾,敖英芳,王薇. 视觉重建对老年人行走动态足底压力的影响[J]. 北京大学学报(医学版), 2021, 53(5): 907-914.
[12] 彭顺壮, 付茜茜, 冯星淋. 中国中老年居民教育程度与失能发生:社会参与的中介作用[J]. 北京大学学报(医学版), 2021, 53(3): 549-554.
[13] 陈家丽,金月波,王一帆,张晓盈,李静,姚海红,何菁,李春. 老年发病类风湿关节炎的临床特征及其心血管疾病危险因素分析:一项大样本横断面临床研究[J]. 北京大学学报(医学版), 2020, 52(6): 1040-1047.
[14] 陈健,左才红,张财义,杨明,张培训. 解剖型髓内钉和股骨近端防旋髓内钉治疗老年股骨转子间骨折的疗效比较[J]. 北京大学学报(医学版), 2019, 51(2): 283-287.
[15] 徐小凤,陈茜,赵艺璞,胡秀英. 我国西部地区居家老年人生活自理能力调查分析[J]. 北京大学学报(医学版), 2018, 50(3): 457-462.
Viewed
Full text


Abstract

Cited

  Shared   
  Discussed   
No Suggested Reading articles found!